Mental Health in Florida
The Centers for Disease Control and Prevention (CDC) defines mental health as our emotional, psychological and social well-being. It is a crucial part of overall health and affects how we think, feel and act. Poor mental health can impact physical health and mental health conditions, like depression, can increase the risk for other health problems like diabetes and heart disease.1
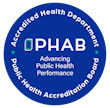
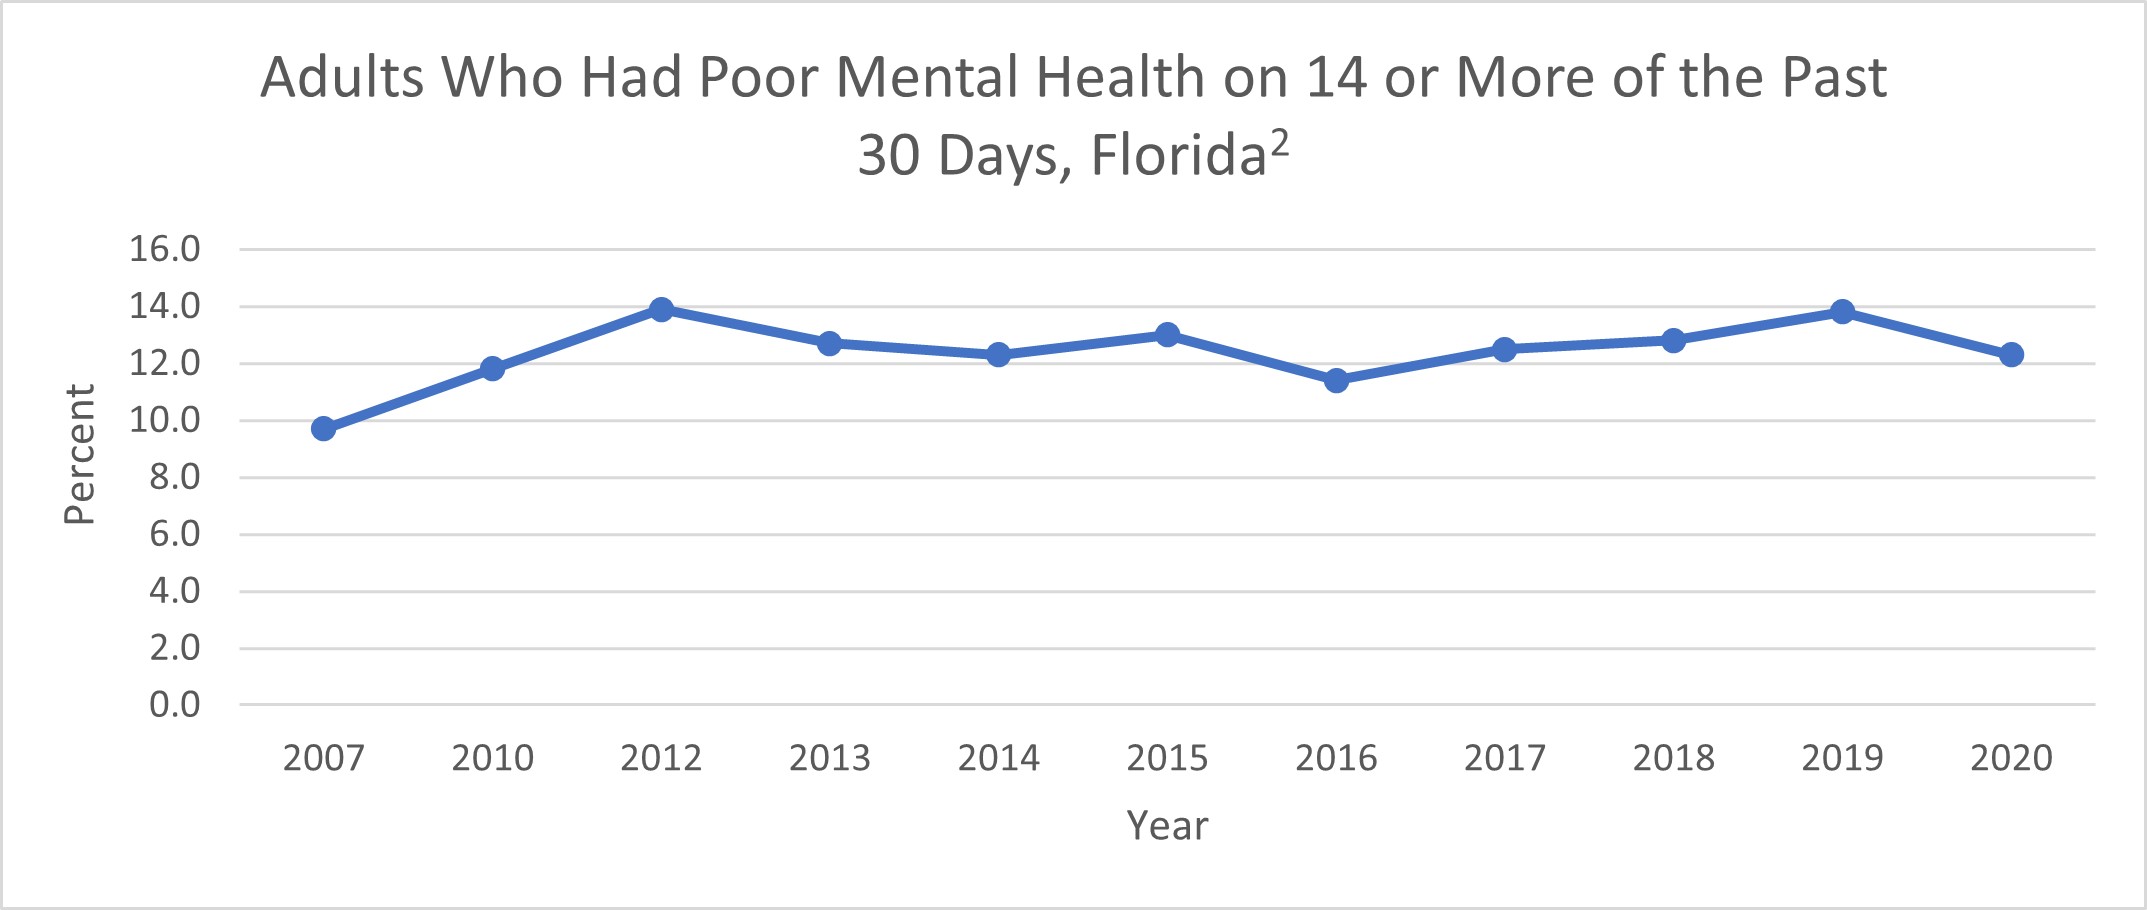
According to the Florida Behavioral Risk Factor Surveillance System telephone survey, the number of adults in Florida who reported having poor mental health on 14 or more of the past 30 days has increased over time. In 2007 the percent of these adults with poor mental health was 9.70% and in 2020 it increased to 12.3%.2 In contrast, the number of adults who reported having good mental health has decreased from 90.30% in 2007 to 87.7% in 2020.3
 Source: Florida Behavioral Risk Factor Surveillance System
 Source: Florida Behavioral Risk Factor Surveillance System
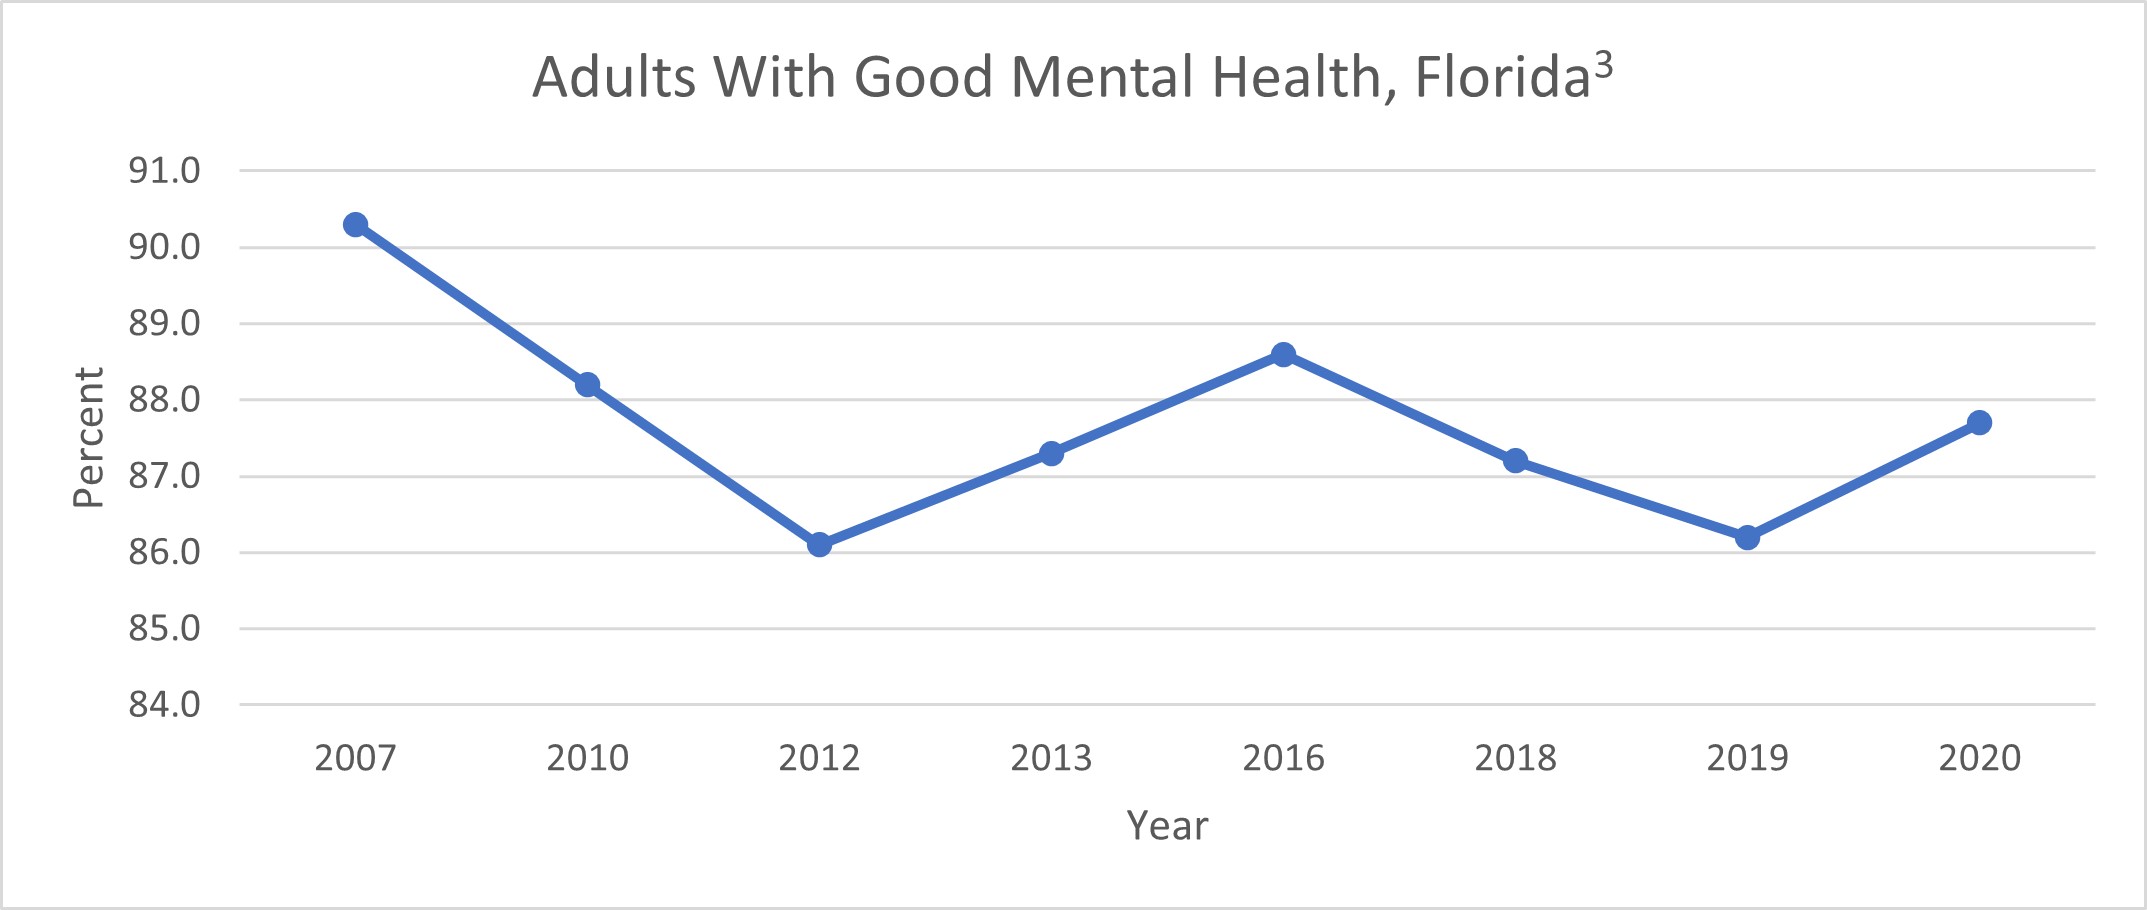
Mental health is important for all ages. The percent of middle and high school students who, in the past year, felt sad or hopeless for two or more weeks in a row and stopped doing usual activities has increased from 22.4% in 2010 to 34.3% in 2021.4
 Source: Florida Youth Tobacco Survey
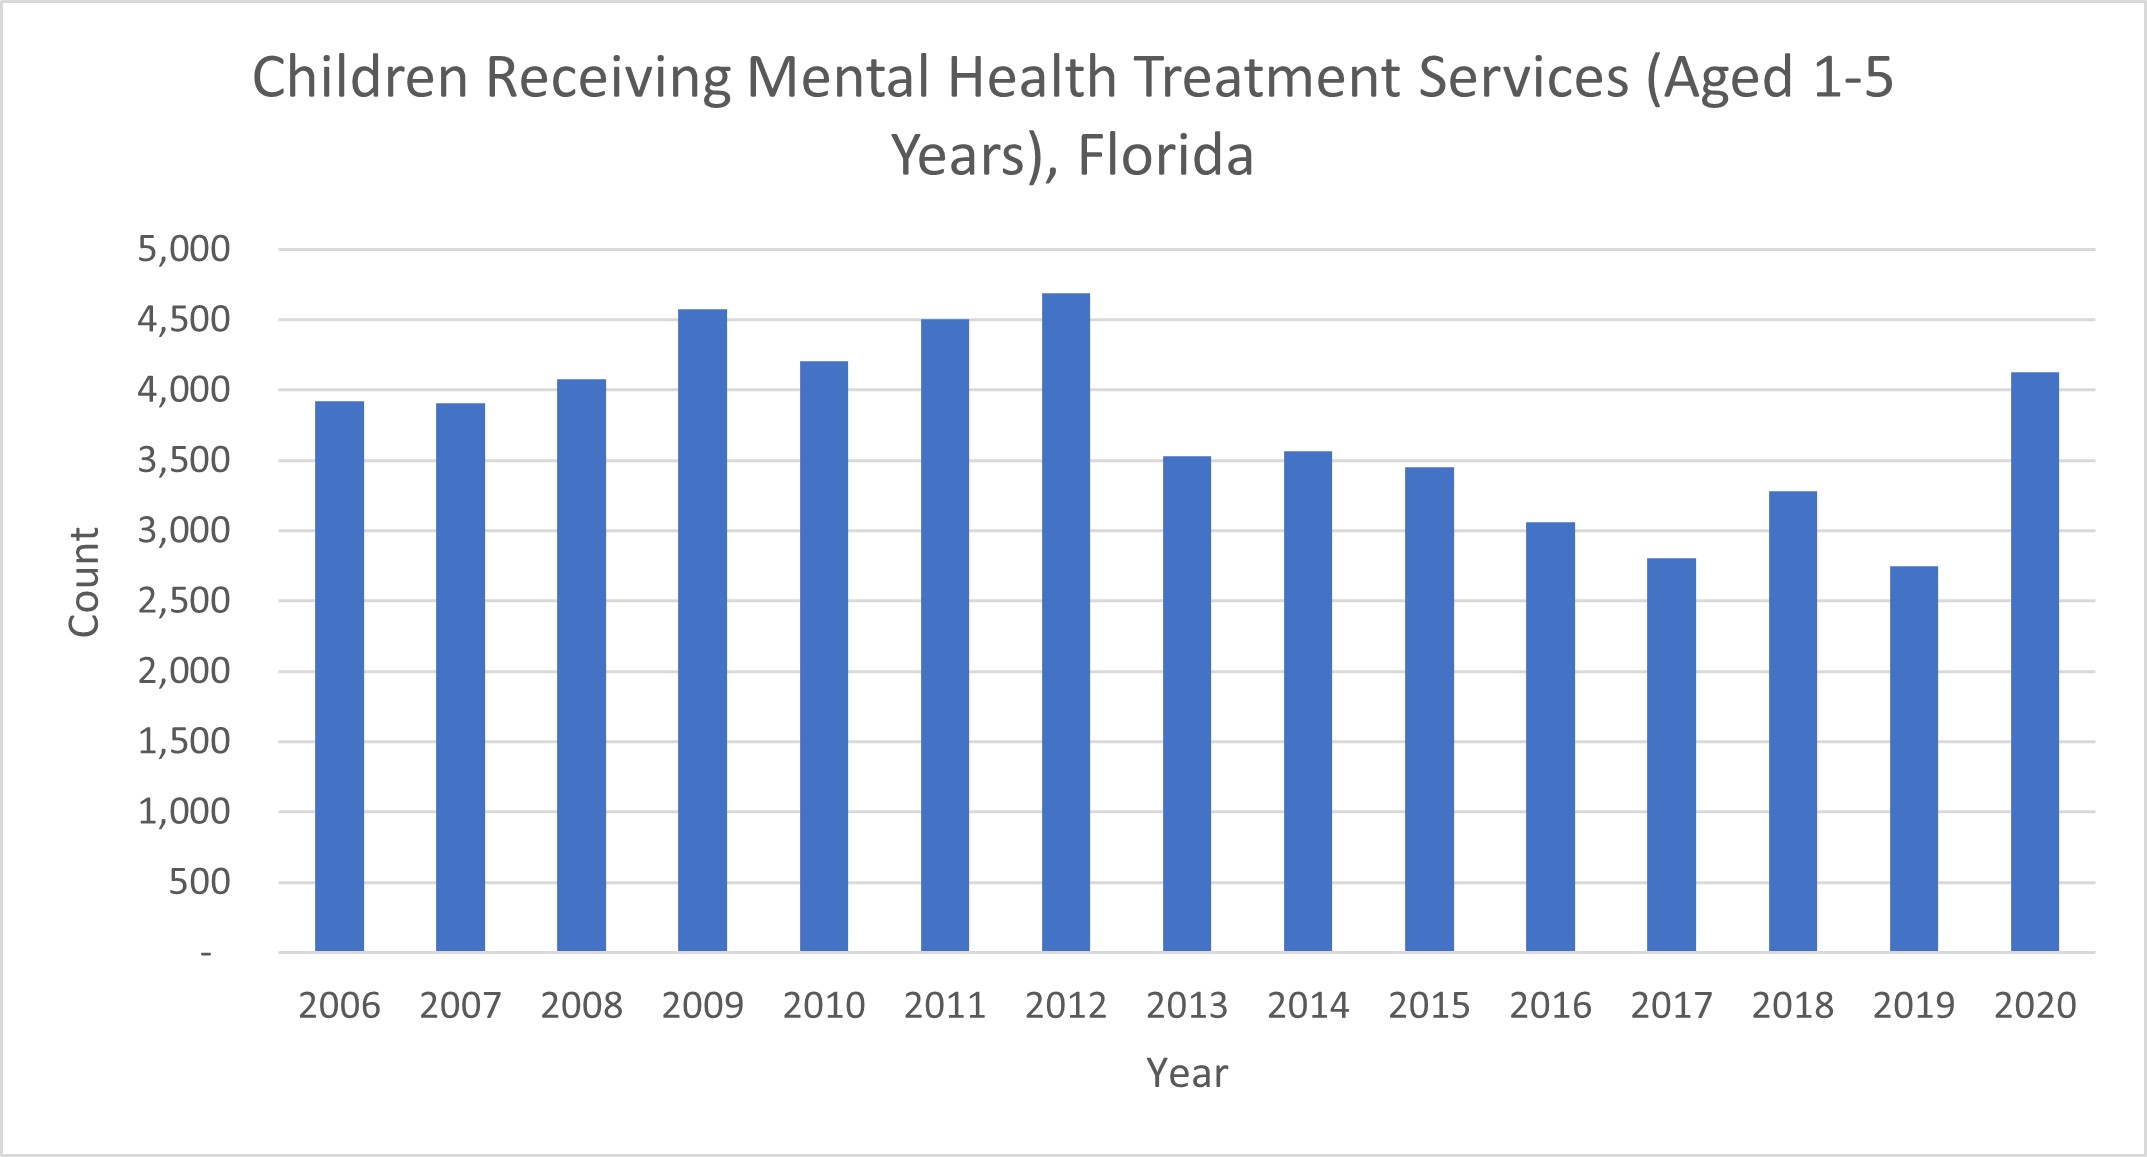
The Florida Department of Children and Families allots funding for in-home or community-based outpatient services, crisis services, or residential mental health treatment for children aged 1-5 years. In 2020 there were 4,126 children who received mental health treatment services through this program. This is an increase from 2,751 in 2019, but a decrease from 4,692 in 2012.5
 Source: Florida Department of Children and Families
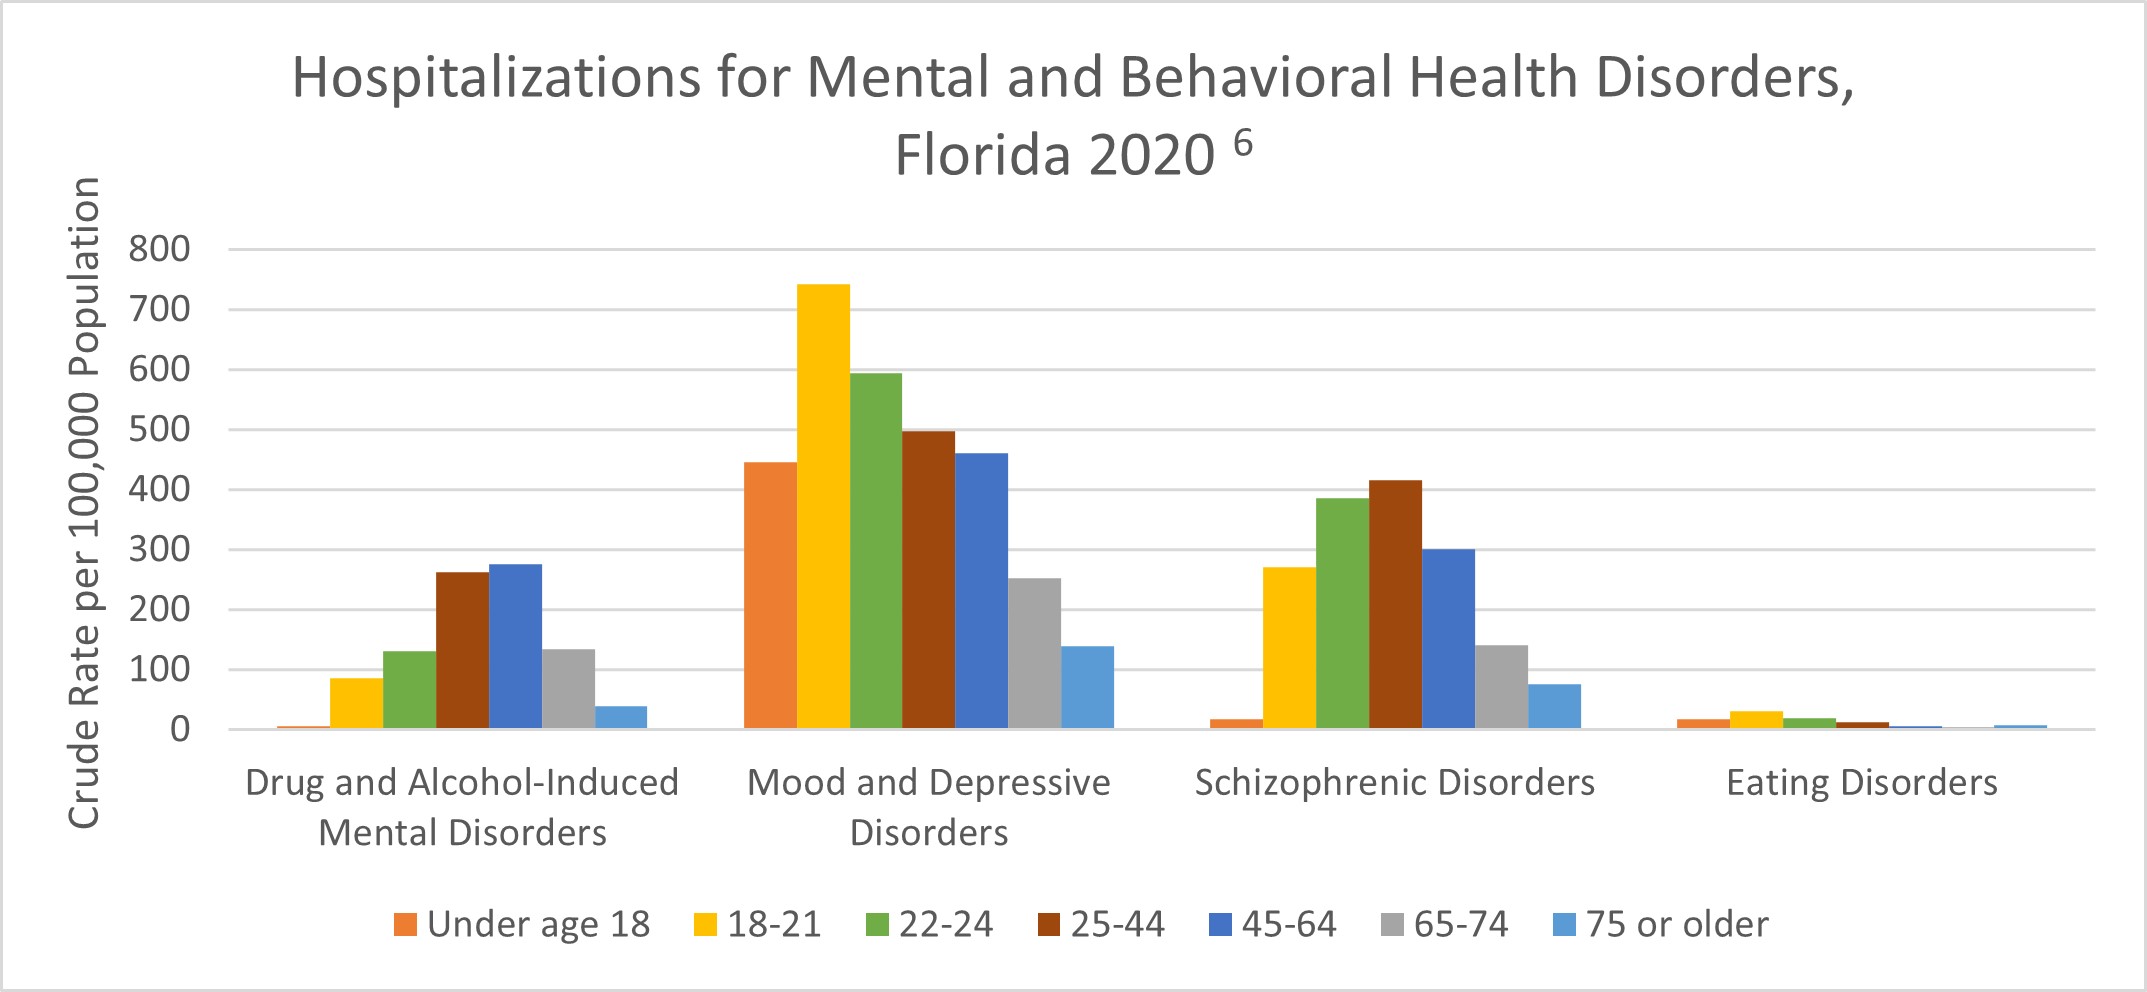
Mental and behavioral disorders, when serious and untreated, can lead to hospitalizations. In 2020, there were 200,907 hospitalizations attributable to all mental disorders where mental disorders were listed as the principal diagnosis. The crude rate of drug and alcohol-induced mental disorders was highest among those 45-64 years of age. The crude rate of schizophrenic disorders was highest among those 25-44 years of age. The crude rate of mood and depressive disorders and eating disorders were both highest among those 18-21 years of age.6
 Source: Florida Agency for Health Care Administration
Sources:
HIV/AIDS
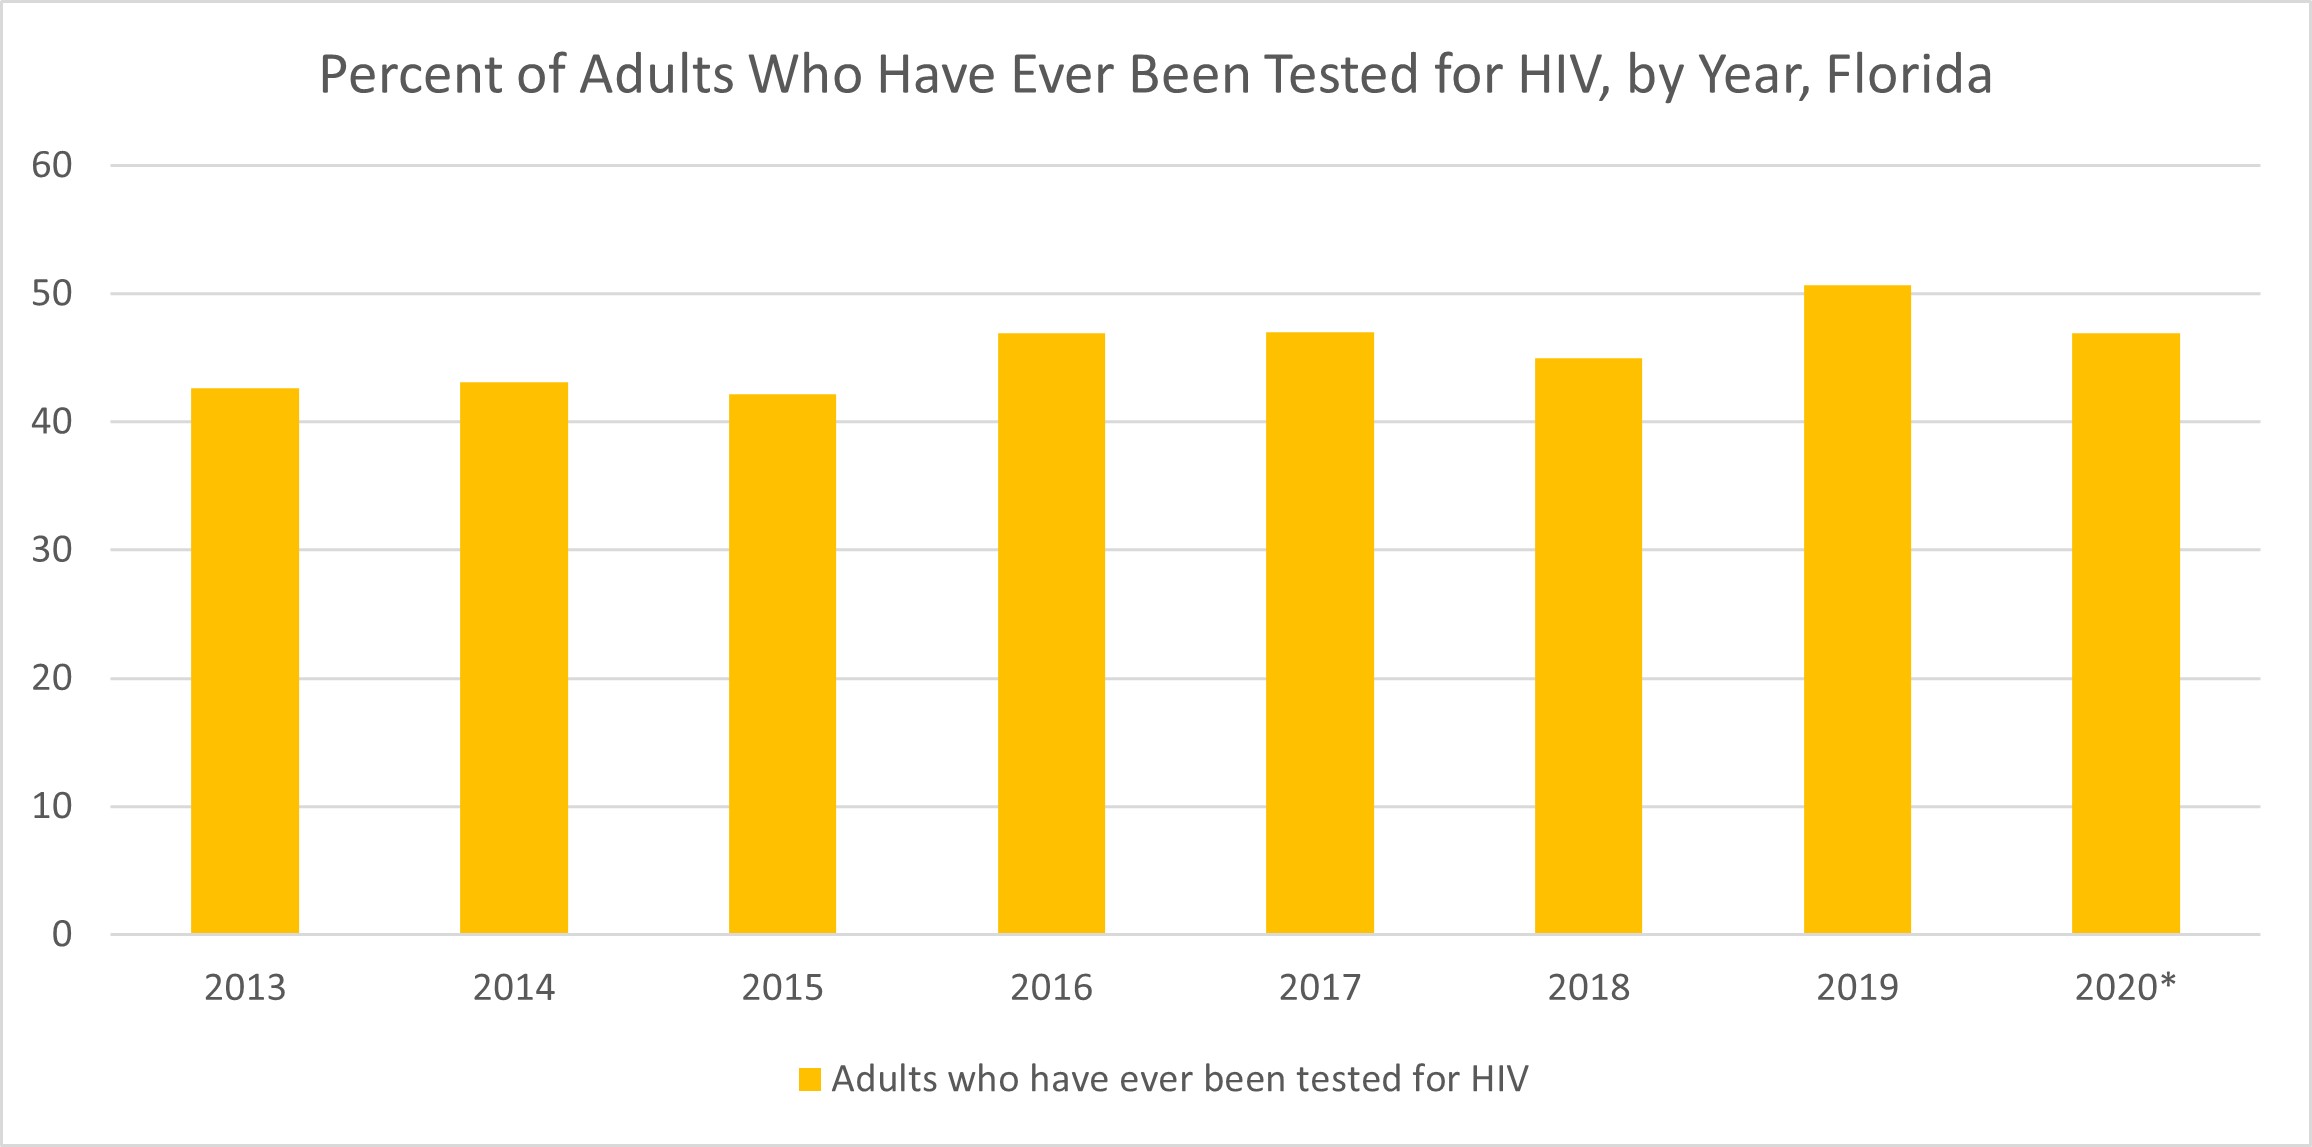
Human immunodeficiency virus (HIV) is a virus which affects the body’s immune system. The late stage of HIV infection is known as acquired immunodeficiency syndrome (AIDS). Since there is no cure, public health programs focus on reducing the transmission of HIV from person to person. Getting tested for HIV is crucial in decreasing transmission, and early diagnosis leads to more effective treatment.1 The percentage of adults in Florida who were tested for HIV increased over time from 2013 to 2019 with a low of 42.6% in 2015 and a high of 50.7% in 2019. In 2020, the percent of adults in Florida who have ever been tested for HIV was 46.9%.2
 Source: Florida Behavioral Risk Factor Surveillance System
*Note: Data for 2020 should be interpreted with caution due to the impact of COVID-19 on HIV testing, care-related services and case surveillance activities in state and local jurisdictions.
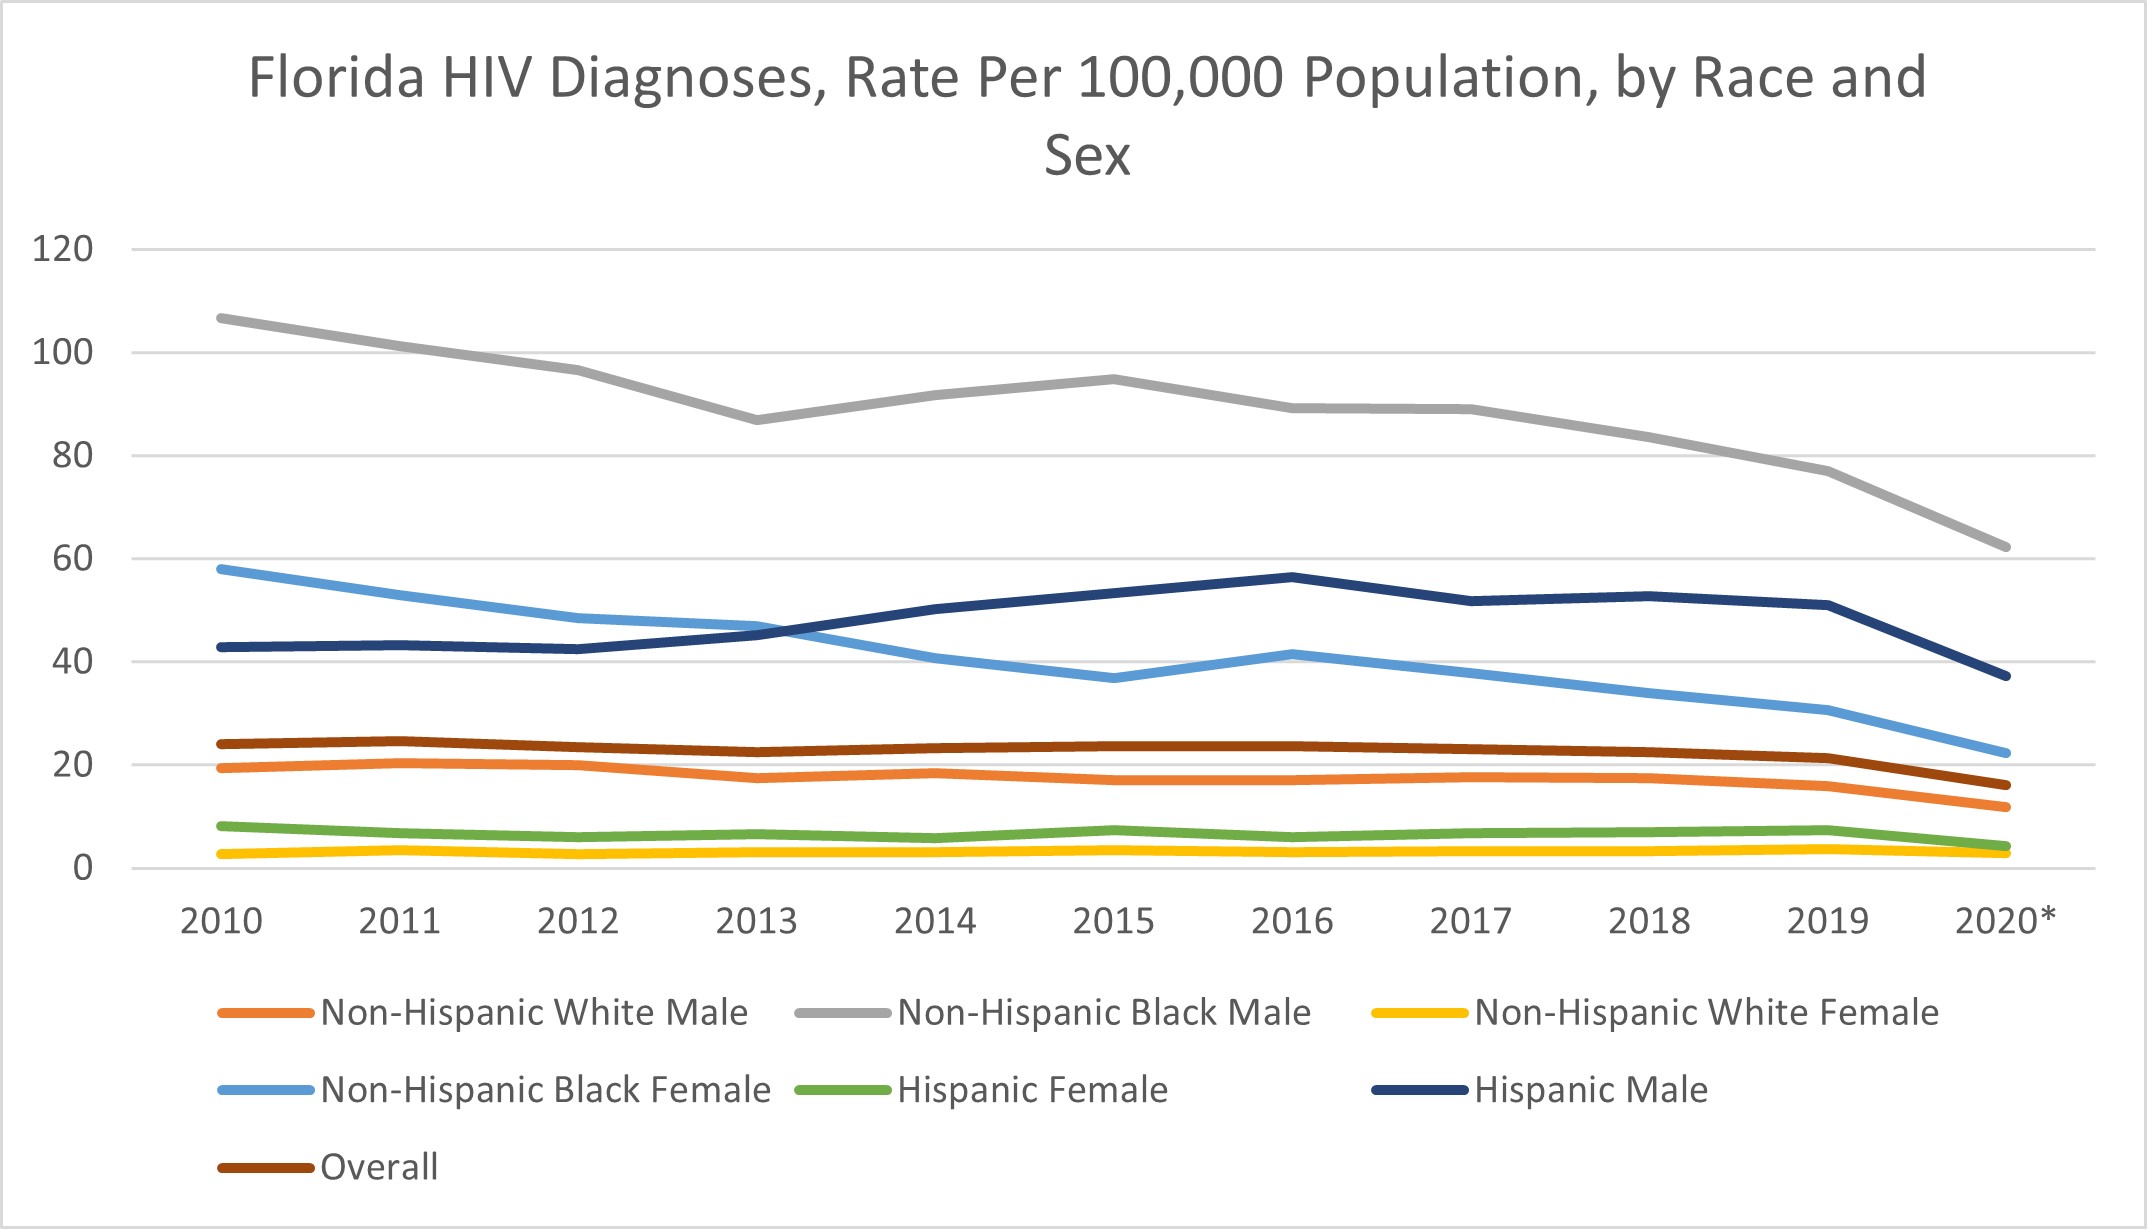
The Florida Department of Health HIV/AIDS Prevention Program focuses on interventions for those who are at high risk of contracting HIV. High risk is associated with behaviors including unprotected sex and needle sharing.3 From 2010 to 2019, the rate of HIV diagnoses in Florida has decreased. In 2010, the overall HIV diagnosis rate was 24.6 per 100,000 population. In 2019, the rate was 21.4 per 100,000 population. In 2019, the non-Hispanic Black male population had the highest rate with 77 HIV diagnoses per 100,000 population. This is followed by the Hispanic male population with an HIV diagnoses rate of 51.1 per 100,000 also in 2019. The rate has consistently been the lowest among the non-Hispanic White female population with a rate of 3.6 per 100,000 population in 2019.4 In 2020, the overall rate was 16.2 per 100,000 population.
 Source: Florida Department of Health
*Note: Data for 2020 should be interpreted with caution due to the impact of COVID-19 on HIV testing, care-related services and case surveillance activities in state and local jurisdictions.
If HIV is left untreated, a person can develop AIDS. This refers to persons diagnosed with HIV whose infection level reaches stage 3 where the number of CD4 lymphocytes falls below less than 200 cells/mm3. Since taking the medication as prescribed stops the progression of the disease, most people in the United States do not develop AIDS.5
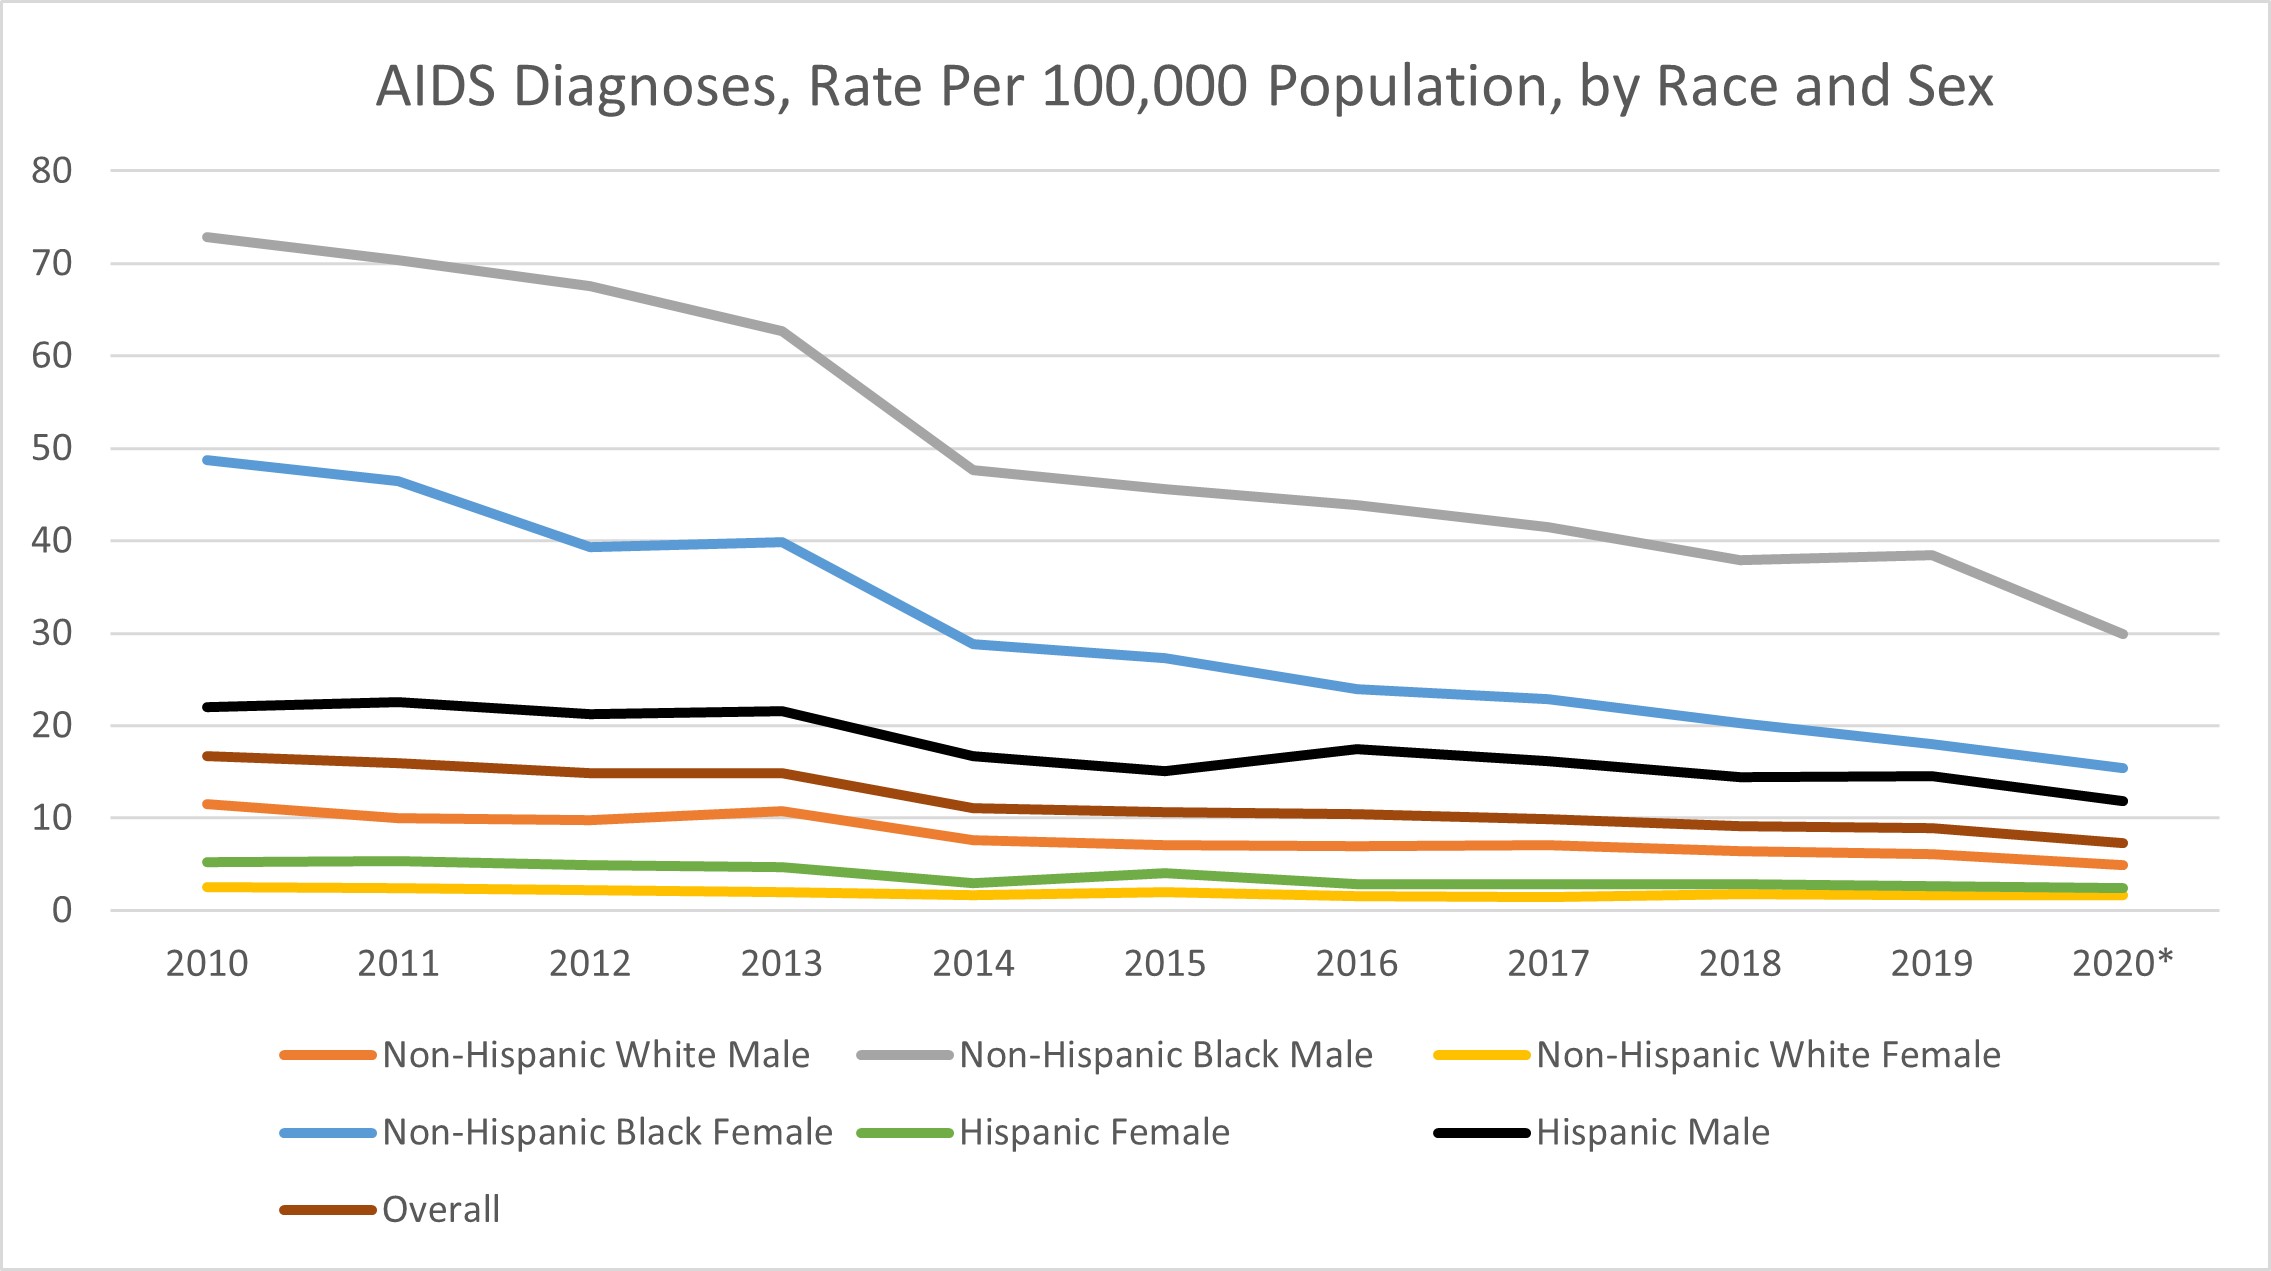
In Florida, like the rate of HIV diagnoses, the rate of AIDS diagnoses is highest among non-Hispanic Black males at 38.5 per 100,000 population in 2019. This is a significant decrease from 2010, where the rate was 72.9 per 100,000 population. The rate in 2019 was lowest among the non-Hispanic White female population with 1.7 AIDS diagnoses per 100,000 population. The overall rate of AIDS diagnoses has decreased from 16.7 per 100,000 in 2010 to 8.9 per 100,000 in 2019. In 2020, the rate was still highest among non-Hispanic Black males and lowest among non-Hispanic White females with 29.9 and 1.7 diagnoses per 100,000 population, respectively.6
 Source: Florida Department of Health
*Note: Data for 2020 should be interpreted with caution due to the impact of COVID-19 on HIV testing, care-related services and case surveillance activities in state and local jurisdictions.
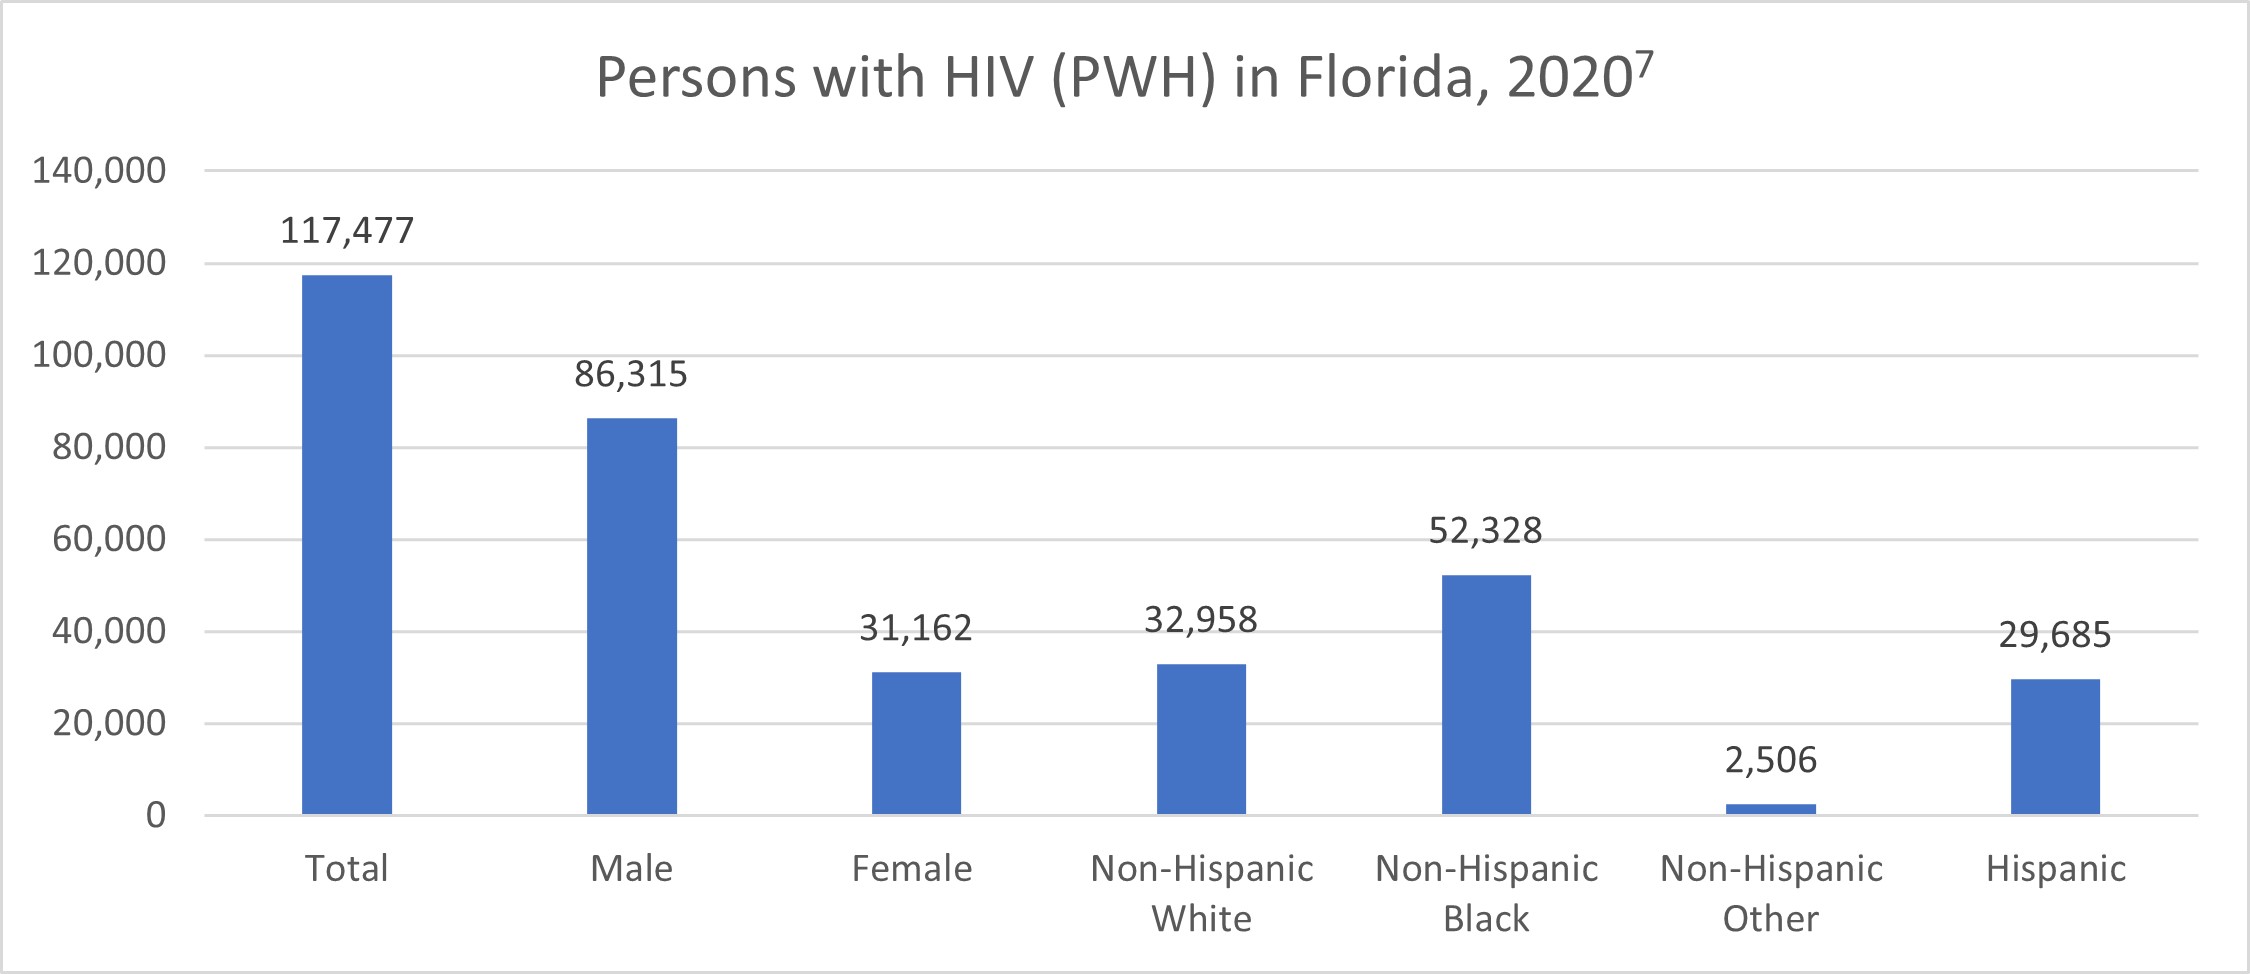
Persons with HIV (PWH), also known as HIV prevalence, is the total number of those who have been diagnosed with HIV. In 2020, there were 117,477 persons with HIV of which 86,315 (73.5%) were male. HIV prevalence was highest in the non-Hispanic Black population.7
 Source: Florida Department of Health
*Note: Data for 2020 should be interpreted with caution due to the impact of COVID-19 on HIV testing, care-related services and case surveillance activities in state and local jurisdictions.
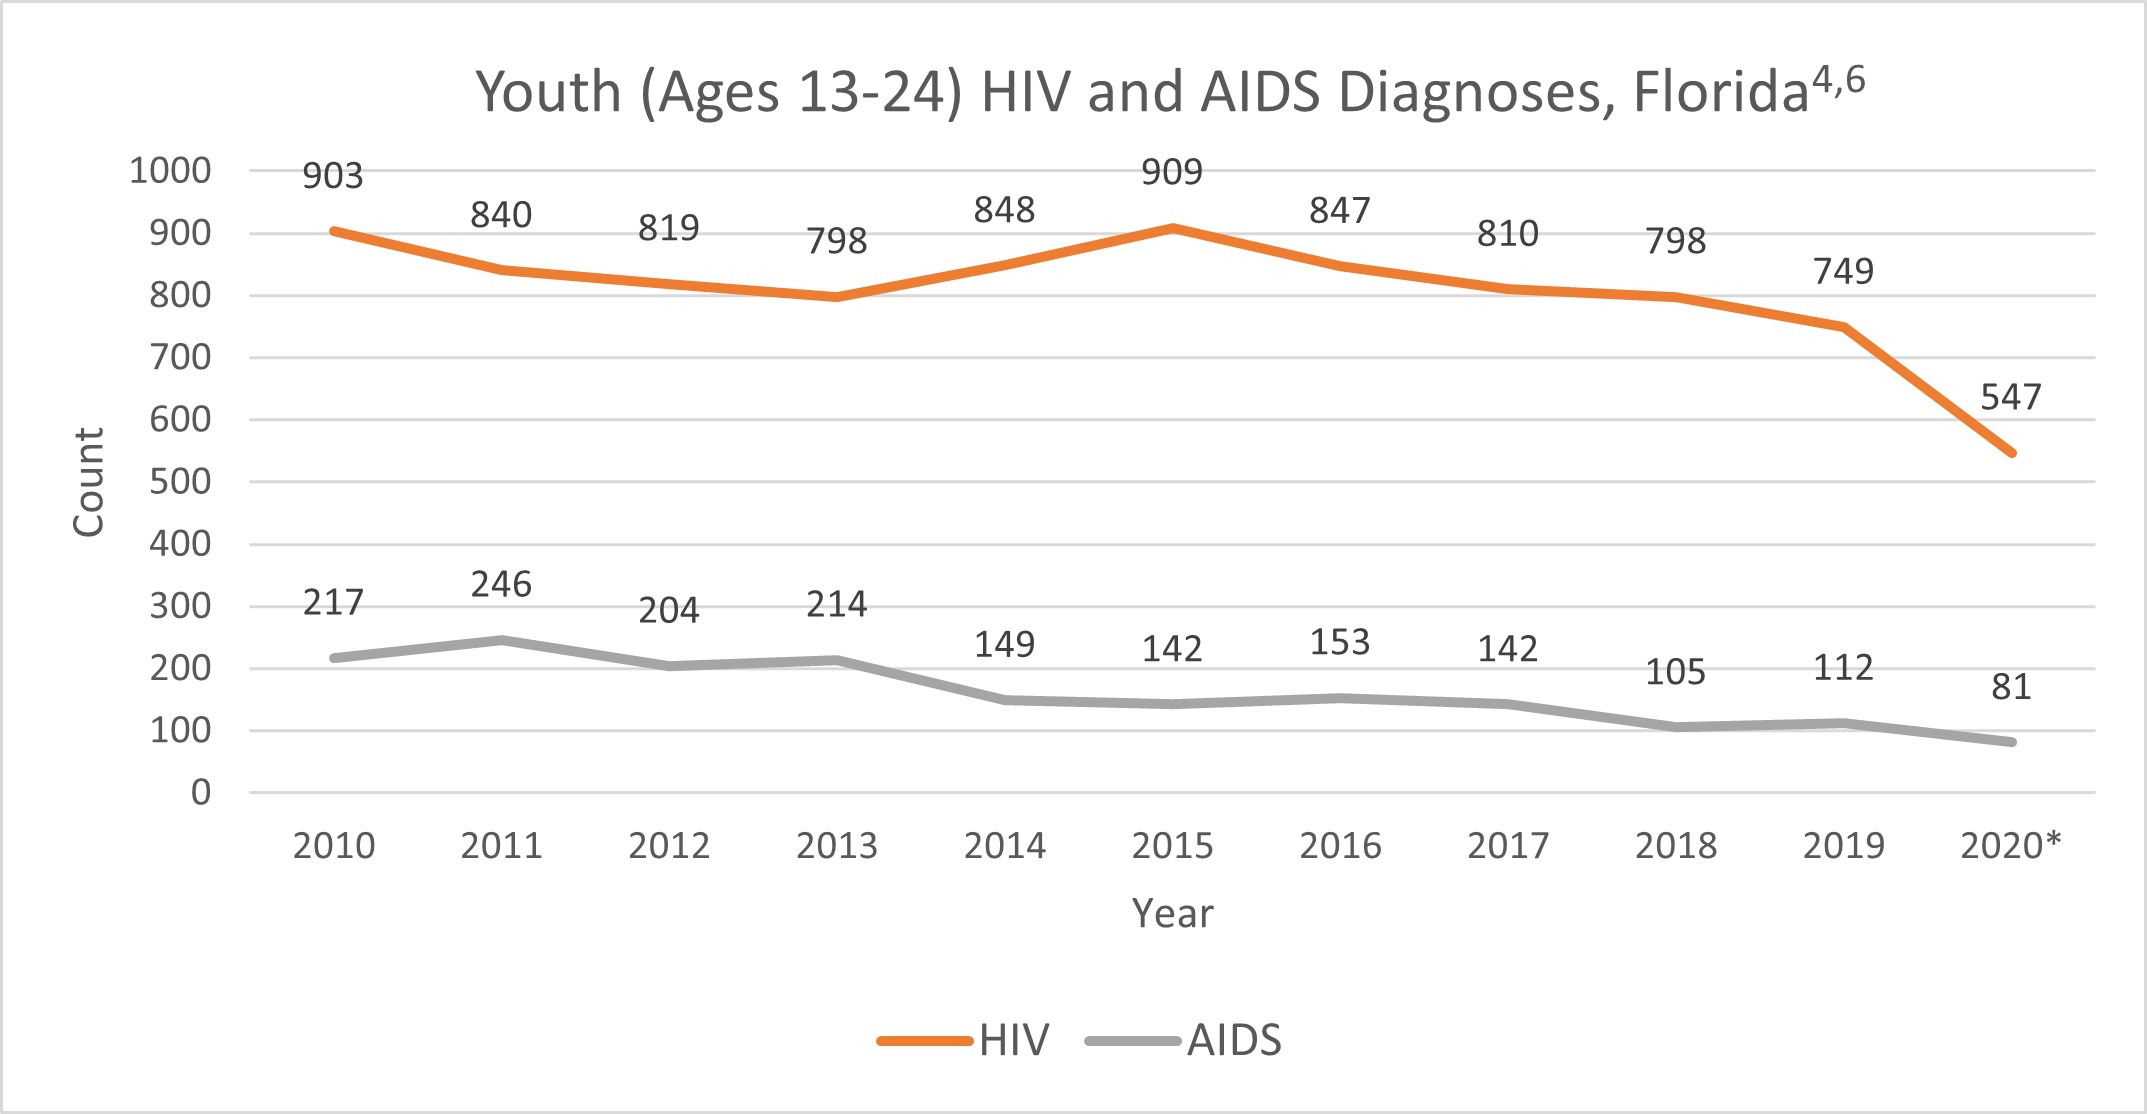
HIV/AIDS affects not only the adult population, but the youth population as well. In Florida, there were 749 HIV diagnoses4 and 112 AIDS diagnoses6 among those aged 13-24 in 2019. This is a decrease in both types of diagnoses from 2010 when there were 903 HIV diagnoses4 and 217 AIDS diagnoses6. In 2020, there were 547 HIV diagnoses4 and 81 AIDS diagnoses6 among those aged 13-24.6
 Source: Florida Department of Health
*Note: Data for 2020 should be interpreted with caution due to the impact of COVID-19 on HIV testing, care-related services and case surveillance activities in state and local jurisdictions.
Sources:
Diabetes
Diabetes is a chronic disease that affects the way your body handles sugar (glucose) in the blood. Most of the food that you consume turns into glucose, which the body uses for energy. However, when the body has excess glucose and cannot regulate glucose levels with insulin in the blood, it can be harmful to the body. Essentially, having high sugar (glucose) in the blood is called “diabetes”.
The two categories of diabetes focused on in this brief are type 1 and type 2 diabetes. Type 1 diabetes is a lifelong condition that is common in children and young adults. They are required to take insulin everyday as their body cannot produce insulin. Type 2 diabetes is the most common form in the population and is usually associated with unhealthy lifestyles or obesity. About 8.1 million people with diabetes do not know they have the disease.1
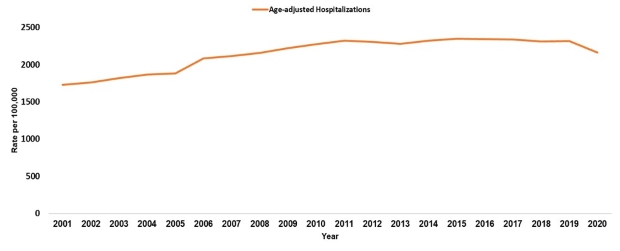
In 2020, the Florida age-adjusted hospitalizations from or with diabetes was 2,160.3 per 100,000 population. This was an increase from 1,726.2 per 100,000 population in 2001. (Chart 1).
Chart 1: Age-Adjusted Hospitalizations From or With Diabetes, Rate per 100,000 Population
 Source: Florida Agency for Health Care Administration (AHCA)
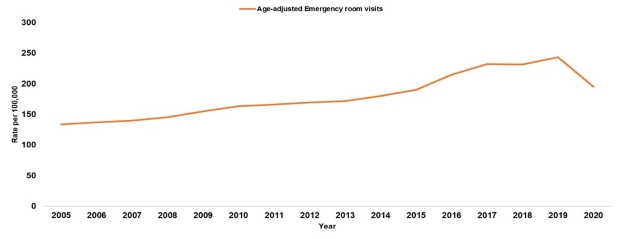
In Florida, emergency room visits where the primary cause of the visit was diabetes was 195.6 per 100,000 population in 2020. This is less than the number of visits in 2017 which was 232.3 per 100,000. This is important because diabetes complications are preventable. These preventable complications can range from years of potential life lost to disability and/or premature death. (Chart 2).
Chart 2: Age-adjusted Emergency Room Visits due to Diabetes, Rate per 100,000 Population
 Source: Florida Department of Health, FLHealthCHARTS
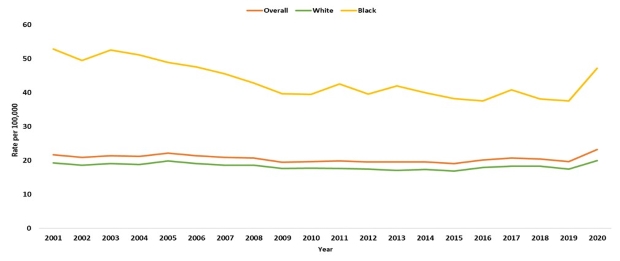
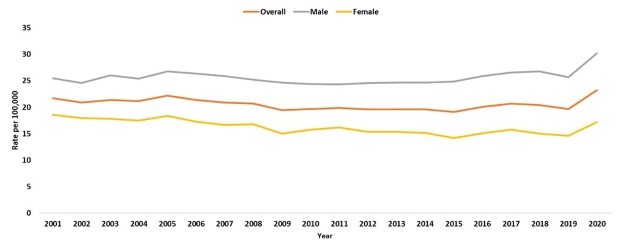
Diabetes can increase the risk of heart disease and stroke and can lead to other serious complications. Unfortunately, in 2020 premature death or death from diabetes occurred at 23.2 per 100,000 population in Florida. The rate in Florida has experience some fluctuation over a 20-year period. The black population has trended higher than all other races and overall since 2001 (Chart 3). The male population has trended higher than females and overall, since 2001 (Chart 4).
Chart 3: Age-Adjusted Deaths from Diabetes, Rate per 100,000 Population, Single Year
 Source: Florida Department of Health, Bureau of Vital Statistics
Chart 4: Age-Adjusted Deaths from Diabetes, Rate per 100,000 Population, Single Year
 Source: Florida Department of Health, Bureau of Vital Statistics
The Florida Department of Health supports lifestyle change programs, such as the Centers for Disease Control and Prevention’s National Diabetes Prevention Program (National DPP) and Diabetes Self-Management Education and Support (DSMES) Programs. For more information about diabetes prevention and management, visit floridahealth.gov/diseases-and-conditions/diabetes, cdc.gov/diabetes, https://www.diabeteseducator.org/home, or diabetes.org. In supplement to the National DPP, an Insulin Distribution Program exist as a safety-net program and is only to be used when there is no other resource available for the insulin.2
Citations
1What is diabetes? | CDC
2National Diabetes Prevention Program (National DPP) | Florida Department of Health (floridahealth.gov)
Heart Disease
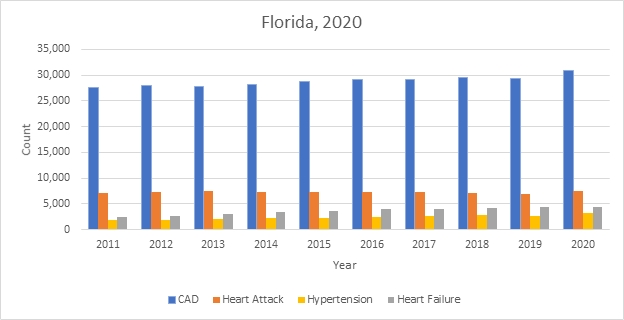
Heart disease is the leading cause of death in Florida, as well as in the United States. In 2020, there were 49,208 age-adjusted deaths from heart diseases per 100,000 population.1 This accounts for 20.56% of total deaths.1
The term heart disease represents several types of heart conditions. The most common of these heart conditions is coronary artery disease (CAD).2 CAD is sometimes called coronary heart disease (CHD) or ischemic heart disease.3 Out of the total number of heart disease deaths in Florida in 2020, CAD (or CHD) caused 62.9%, or 30,961 deaths.4
Chart 1: Number of Heart Disease Deaths by Type6
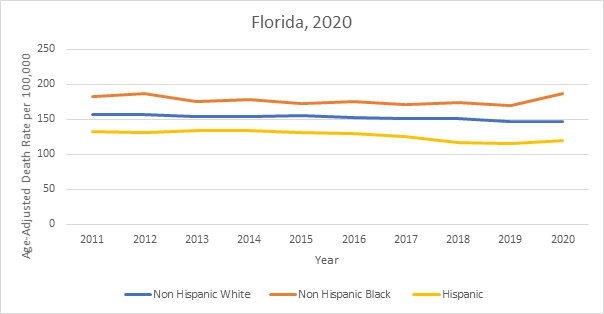
Some racial and ethnic groups are more likely to have heart disease than others, although anyone can be affected.5 Non-Hispanic Blacks in Florida had the highest age-adjusted death rate (AADR) for heart disease at 187.7 deaths per 100,000 population in 2020. In the same year the AADR for Hispanics was 119.4 deaths per 100,000 population. The average AADR over the past 10 years for Non-Hispanic Black, Non-Hispanic White and Hispanic was 177.4, 152.8 and 127.1 deaths per 100,000 population, respectively.6
Chart 2: Heart Disease AADR By Race and Ethnicity6
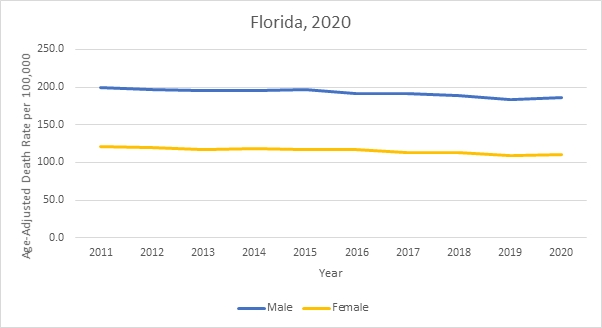
In addition, heart disease disproportionally affects men compared to women. The AADR by gender shows that in 2020 there were 186.6 deaths per 100,000 population in men, and 111.0 deaths per 100,000 population in women.7 However, the risk for developing heart disease remains prevalent in women, especially among Non-Hispanic Black women.
Chart 3: Heart Disease AADR by Gender7
Some risk factors for heart disease can be controlled and some cannot. Race, ethnicity, gender and family history are examples of factors that cannot be controlled but have an impact on a person’s overall risk for heart disease. Many factors such as physical activity, smoking and amount of sleep can be controlled to prevent heart disease.
Prevention and risk of heart disease can be reduced by following these heart-healthy tips:
- Be more physically active; aim for 30 minutes at least five days a week.
- Maintain a healthy weight.
- Eat a nutritious diet with less fat and more fruits and vegetables.
- Quit smoking.
- Reduce stress.
- Get 7-8 hours of quality sleep each night.
- Talk to your health provider about checking your blood pressure, cholesterol and blood glucose, then follow your provider's advice.
By living a healthy lifestyle, you can help keep your blood pressure, cholesterol, and blood sugar levels normal, which will lower your risk for heart disease and heart attack. Your health provider or county health department can help you get started with helpful information about diet, exercise, quitting smoking and blood pressure management.8
Sources:
Tobacco Use
Tobacco use is the leading cause of preventable disease, disability, and death in the United States. Tobacco product is defined as any product made or derived from tobacco that is intended for human consumption, including any component, part, or accessory of a tobacco product.1 This can include nicotine products as well as electronic vapor products (EVP). Tobacco use by smoke inhalation is the most common. Inhaled nicotine use is defined as use of cigarettes, cigars, hookah, electronic vapor products, flavored cigarettes, flavored cigars, or flavored electronic vapor products. Additionally, smokeless tobacco products are also used including chewing tobacco and snuff.2
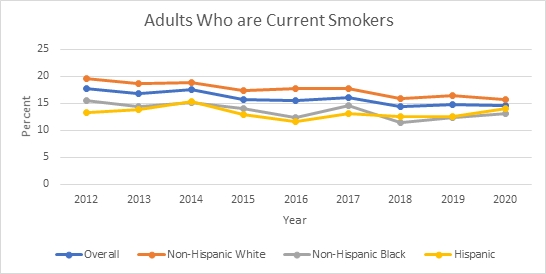
In Florida, the percent of adults who are current smokers has decreased significantly over the past 10 years. However, from 2018-2020 the percent of adults who are current smokers has stayed consistent between 14.5-14.8%. In 2020, Non-Hispanic Whites have the highest percentage of smokers at 15.7% and non-Hispanic Blacks have the lowest percentage of smokers at 13.2%.3
Chart 1: Adults Who are Current Smokers3
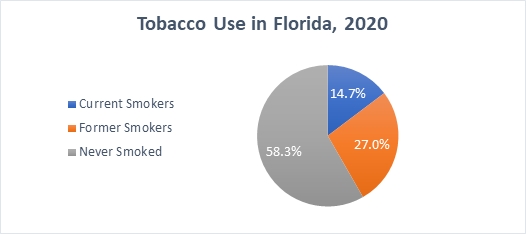
Most deaths and diseases from tobacco use are caused by cigarettes.4 Tobacco use can lead to heart disease, stroke, cancer, diabetes, gum disease, chronic obstructive pulmonary disease (COPD) and more.5 Almost half, or 41.7 percent, of Florida residents are either current or former smokers3 and therefore have an increased risk for developing these health conditions.
Chart 2: Overall Tobacco Use 20203
Tobacco use and smoking effects every organ in the body and contributes to many types of cancer. In 2020 there were 19,656 tobacco-related cancer deaths in Florida.7 However, there has been consistent decrease in these deaths over the past 20 years. In 2001, the age-adjusted tobacco-related cancer death rate was 96.9 deaths per 100,000. Whereas in 2020 this rate was 60.2 deaths per 100,000 population.
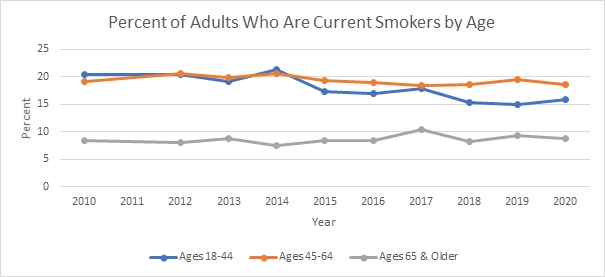
The use of tobacco has the highest prevalence in middle-aged populations. In 2020, 18.7% of adults who are ages 45-64 are current smokers. This is greater than the percent of adults who are current smokers ages 18-44, which is 15.9%. However, there is a significant decrease in the percent of adults who are current smokers ages 65+, where the percent is 8.7%.3
Chart 3: Current Smokers by Age3
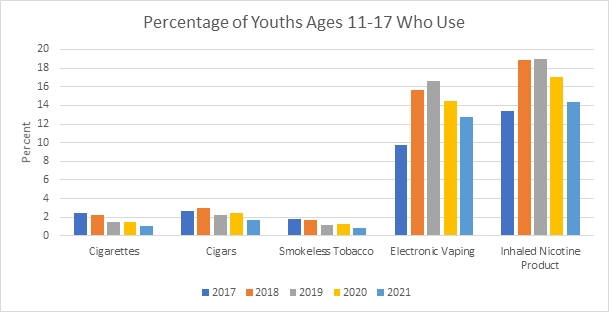
Youth tobacco use prevention continues to be imperative to the overall decline of all inhaled nicotine products. The Florida Department of Health Youth Tobacco Survey focuses on youth populations ages 11-17. Current use of four tobacco products including cigarettes, cigars, hookah, and smokeless tobacco has declined from 2017-2021 for those ages 11-17. However, in the 2021 Youth Tobacco Survey Data Report, electronic vapor product (EVP) use had an 30.6% percent increase for youth ages 11-17 from 2017-2021. Additionally, there was an increase in those who have ever tried inhaled nicotine product. Evidence supports that those who use EVP may be at greater risk of smoking regular cigarettes and nearly nine out of 10 current adult smokers started before the age of 18 years6
Chart 4: Youth Tobacco Use6
FLHealthCHARTS.gov Reports
National Reports
Cited Sources:
Cancer
Cancer can start almost anywhere in the human body. It is a disease in which some of the body’s cells grow uncontrollably and spread to other parts of the body.1
Cancer is the second leading cause of death in Florida2 and the U.S. According to the Centers for Disease Control and Prevention (CDC), The 2019 U.S. age-adjusted cancer death rate was 146.2 per 100,000 population. Among all cancer deaths, approximately 23% of Americans die from lung cancer, making it the primary leading cause among cancer deaths.3
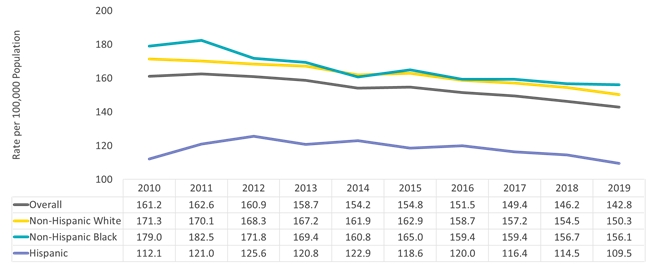
Other leading causes of cancer deaths include colon and rectum, pancreas, female breast, prostate and liver and intrahepatic bile duct cancer.3 From 2010 to 2019, Florida age-adjusted cancer death rates decreased from 161.2 per 100,000 population to 142.8 per 100,000 population. Non-Hispanic Blacks had the highest rate of age-adjusted cancer deaths, although the rate among Non-Hispanic Whites was also high.4
Chart 1: Cancer, Age-Adjusted Death Rate per 100,000 Population by Race and Ethnicity, Florida, 2010-2019
 Source: Florida Bureau of Vital Statistics
Preventive health care services, such as screenings, can detect cancer before symptoms start; treatment is most beneficial when cancers are detected early. The most effective cancer screenings which have led to reduced deaths include screenings for breast, cervical, lung and colorectal cancers. Screening for skin cancer, specifically melanoma of the skin, and prostate cancer has also contributed to the reduced morbidity and mortality due to cancer in Florida as well.
Men have higher cancer incidence (473.1) and death rates from cancer compared to women (417.9). Black females have a lower cancer incidence than White females, but there is no significant difference in their death rates. Historically, Black men have had both a higher incidence and death rate due to cancer than White men. In recent years, the gap has decreased (See Table 1).
Table 1: 2017 Age-Adjusted Cancer Rates
| Race/Gender |
Incidence5 |
Deaths4 |
| Male |
473.1 |
178.1 |
| Female |
417.9 |
126.7 |
| Black females |
364.3 |
130.2 |
| White females |
418.3 |
126.9 |
| Black males |
432.2 |
190.2 |
| White males |
465.7 |
177.9 |
*Rates are age-adjusted per 100,000 population.
The State Health Improvement Plan aims to reduce cancer incidence and increase cancer survival. FLHealthCHARTS.gov offers additional information through its cancer incidence and death indicators as well as the death query system. To learn more about cancer control efforts in Florida, please visit this page: www.floridahealth.gov/diseases-and-conditions/cancer/cancer-control-florida.html.
Citations
1National Cancer Institute. What Is Cancer? Bethesda, MD. U.S. Department of Health and Human Services, 2021.
What Is Cancer? - National Cancer Institute
2Florida Department of Health, FLHealthCHARTS.gov Reports, 2019.
Leading Causes of Death (flhealthcharts.gov)
3An Update on Cancer Deaths in the U.S. | CDC.
An Update on Cancer Deaths in the United States | CDC
4FL HEALTH CHARTS - FLHealthCHARTS - Death Rate Query System. Tallahassee, FL: Florida Department of Health; 2021.
Death Rate Query System (flhealthcharts.gov)
4Florida Annual Cancer Report: 2017 Incidence and Mortality. Tallahassee: Florida Department of Health, 2021.
https://fcds.med.miami.edu/inc/publications.shtml
Injury, Safety and Violence
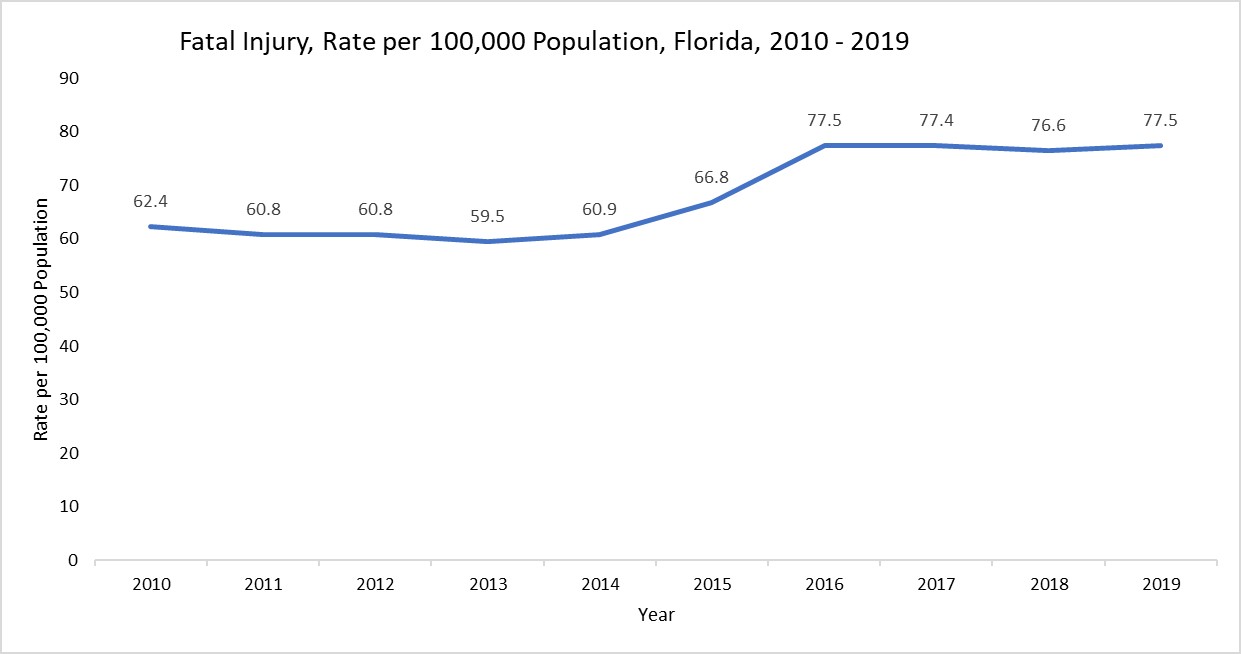
Injury is defined as1 “physical harm or damage to someone’s body.” Whether intentional or unintentional, injuries can be predicted and prevented. Unintentional injuries include those that result from accidental motor vehicle collisions (including those that involve pedestrians and bicyclists), drownings, falls, firearms and recreational and sports-related activities. Intentional injuries result from interpersonal or self-inflicted violence, and include homicide, assaults, suicide and suicide attempts, child abuse and neglect (including child sexual abuse), intimate partner violence, elder abuse and sexual assault.1 From 2010 to 2019, the trend in age-adjusted injury rate increased from 62.4 to 77.5 per 100,000 population, respectively.2
Chart 1: Fatal Injury Rate2
 Source: Florida Bureau of Vital Statistics
Unintentional injuries are the leading cause of death among Florida residents ages 1-44 and the fourth leading cause of death overall. Suicide is the eighth leading cause of death overall among Florida residents.3 In 2019, Florida’s age-adjusted injury rate for all injuries was 8.90 percent higher than the national average.4 Compared with the nation's six most populous states, Florida's injury death rates were highest in the following categories: motor vehicle injuries, suicides, drowning, pedestrian, and pedal cyclist.
Injuries and violence can have an economic impact in the United States. Nearly $130 billion of the fatal injury costs were attributable to unintentional injuries, followed by suicide ($50.8 billion) and homicide ($26.4 billion).4 Florida's Violence and Injury Prevention Section addresses statewide injury prevention priorities by providing technical assistance, information and resources to community partners. Some of these programs include, WaterSmartFL, Safe Kids Florida and Family Fire Safety Plan.5
Citations
1Injury Prevention. (March 11, 2021). Florida Department of Health. Retrieved October 5, 2021 from Injury Prevention | Florida Department of Health (floridahealth.gov)
2Florida Department of Health, Bureau of Vital Statistics
3Florida Vital Statistics Annual Report 2019
4Centers for Disease Control and Prevention, National Center for Injury Prevention and Control
4Florida Department of Health, Violence and Injury Prevention Section
Syphilis
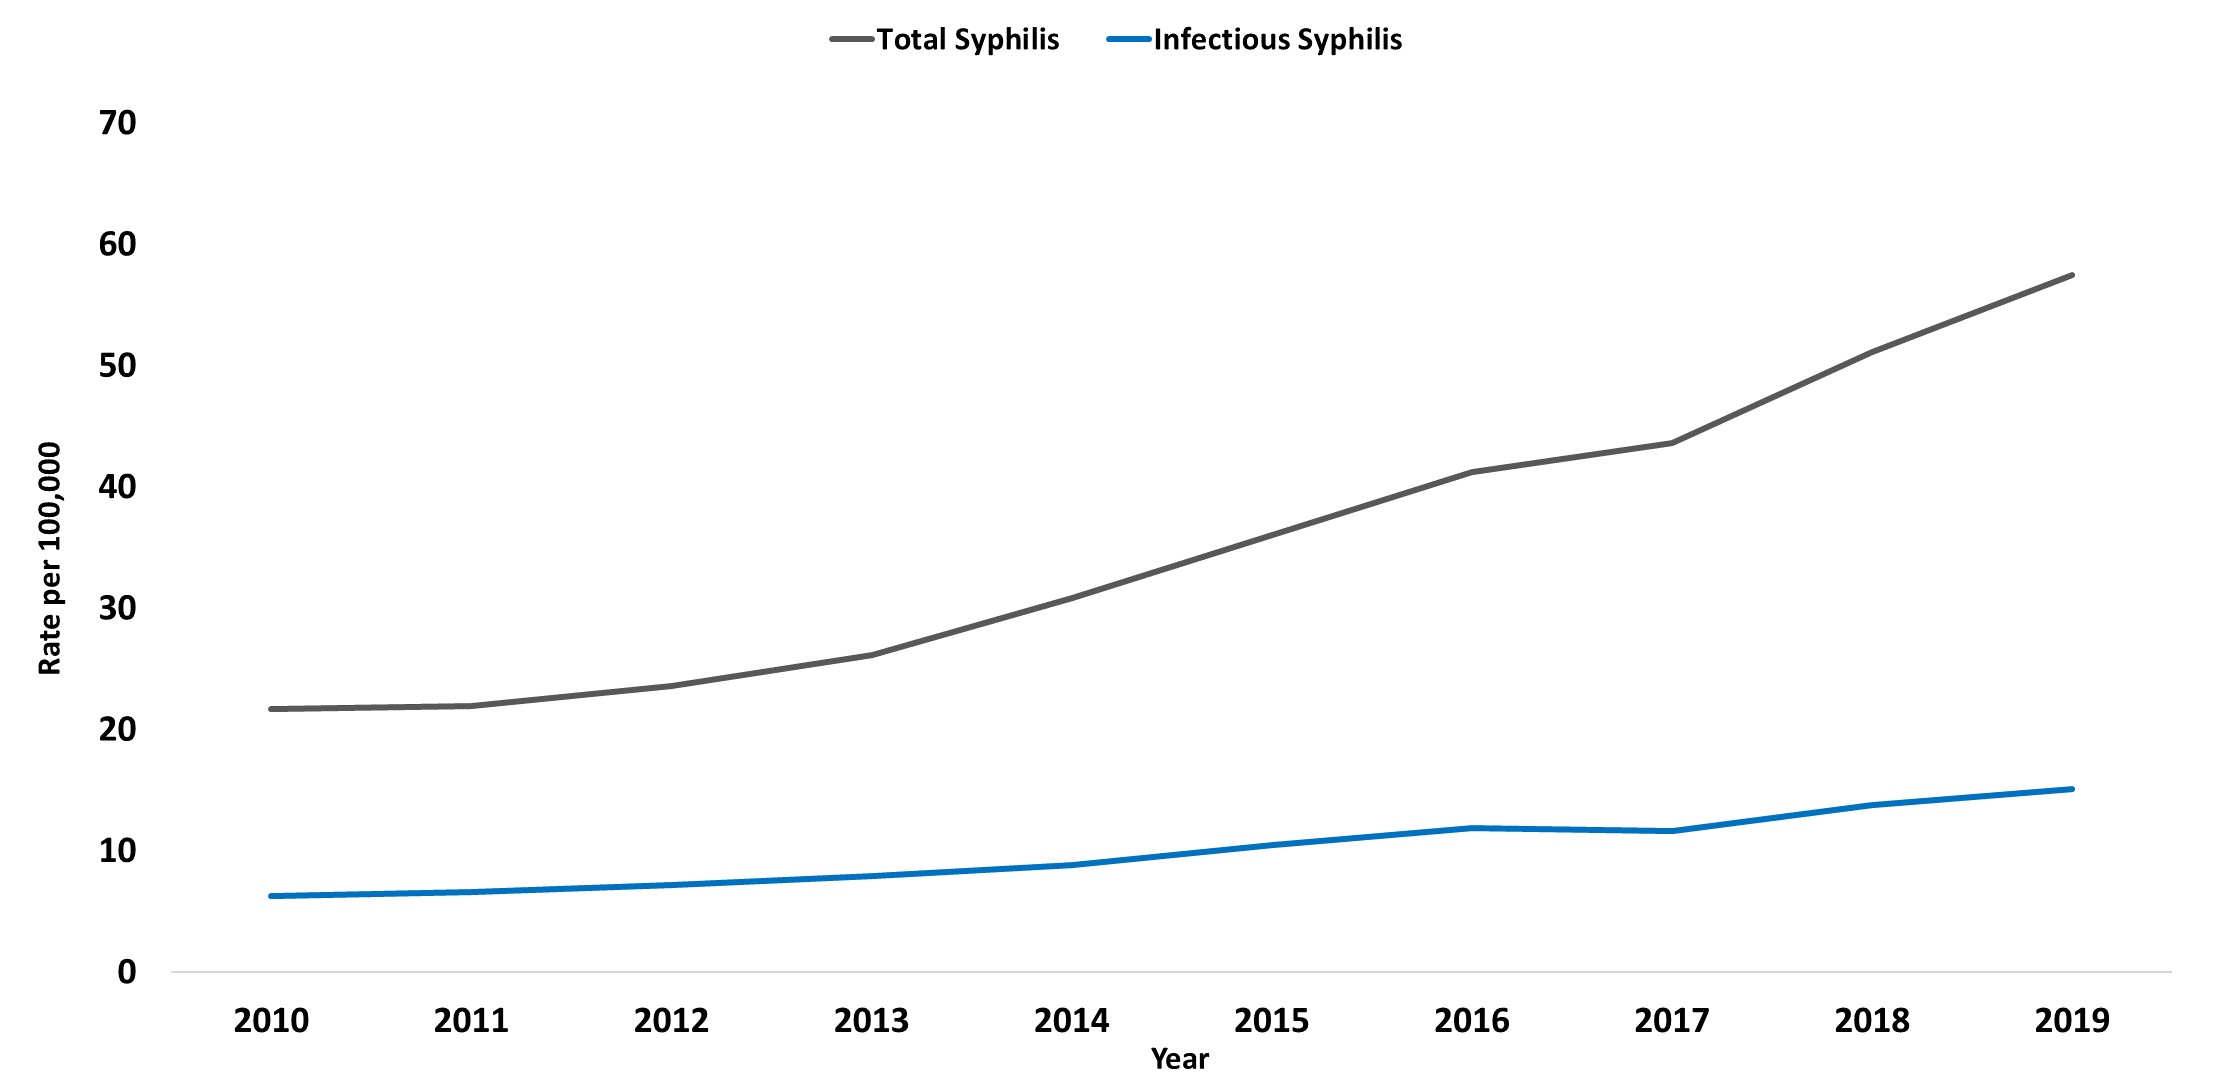
In 2019, 129,813 cases of syphilis were reported in the United States, including 38,992 cases of primary and secondary (P&S) syphilis. The most infectious stages of the disease or symptomatic stages are primary and secondary syphilis, also known as infectious syphilis. P&S syphilis reached historic lows in 2000 and 2001, however the rate has increased almost every year since, increasing 11.2% during the 2018-2019 calendar years. Rates increased among both males and females, in all regions of the United States and among all racial/Hispanic ethnicity groups1.
Rates of P&S syphilis have increase among men, particularly among men who have sex with men (MSM). Although cases have been slowing among the MSM group, they have accounted for a majority (56.7%) of all male P&S syphilis cases in 2019 nationally. Rates for women increased 30% during 2018-2019 and 178.6% during 2015–2019, suggesting the heterosexual syphilis epidemic continues to rapidly increase.1 Syphilis accounted for an estimated $174 million in direct medical cost in the United States in 2018.2
Total Syphilis cases in Florida increased approximately 200% from 4,078 in 2010 to 12,233 in 2019. The rate of syphilis per 100,000 increased almost every year since 2010. Males increased 215% from 3,158 in 2010 to 9,963 in 2019. Females had an increase of about 146% during the same time period. Also, Infectious syphilis cases increased 171% during the same period.
Syphilis — Rates of Reported Cases by Stage of Infection, Florida, 2010–2019
Congenital Syphilis
Nationally, the 2013 rate of congenital syphilis (9.2 cases per 100,000 live births) marked the first increase in congenital syphilis since 2008. Since 2013, the rate of congenital syphilis has increased each year. In 2019, 1,870 cases of congenital syphilis were reported. Although most cases were reported from just a few states, 44 jurisdictions (43 states and the District of Columbia) reported at least one case of congenital syphilis in 2019. The national rate of 48.5 cases per 100,000 live births in 2019 represents a 41.4% increase relative to 2018 and 291.1% increase relative to 2015.1
From 2018 to 2019, the number of syphilitic stillbirths in the United States increased (from 79 to 94 stillbirths), as did the number of congenital syphilis related infant deaths (from 15 to 34 deaths). In 2019, the most common missed congenital syphilis prevention opportunity was a lack of adequate maternal syphilis treatment despite receipt of a timely syphilis diagnosis (40.2%). The second most common missed congenital syphilis prevention opportunity in 2019 was a lack of timely prenatal care and subsequent lack of timely syphilis testing (36.3%).1
Congenital Syphilis — Reported Cases of Infection, Florida, 2010–2019
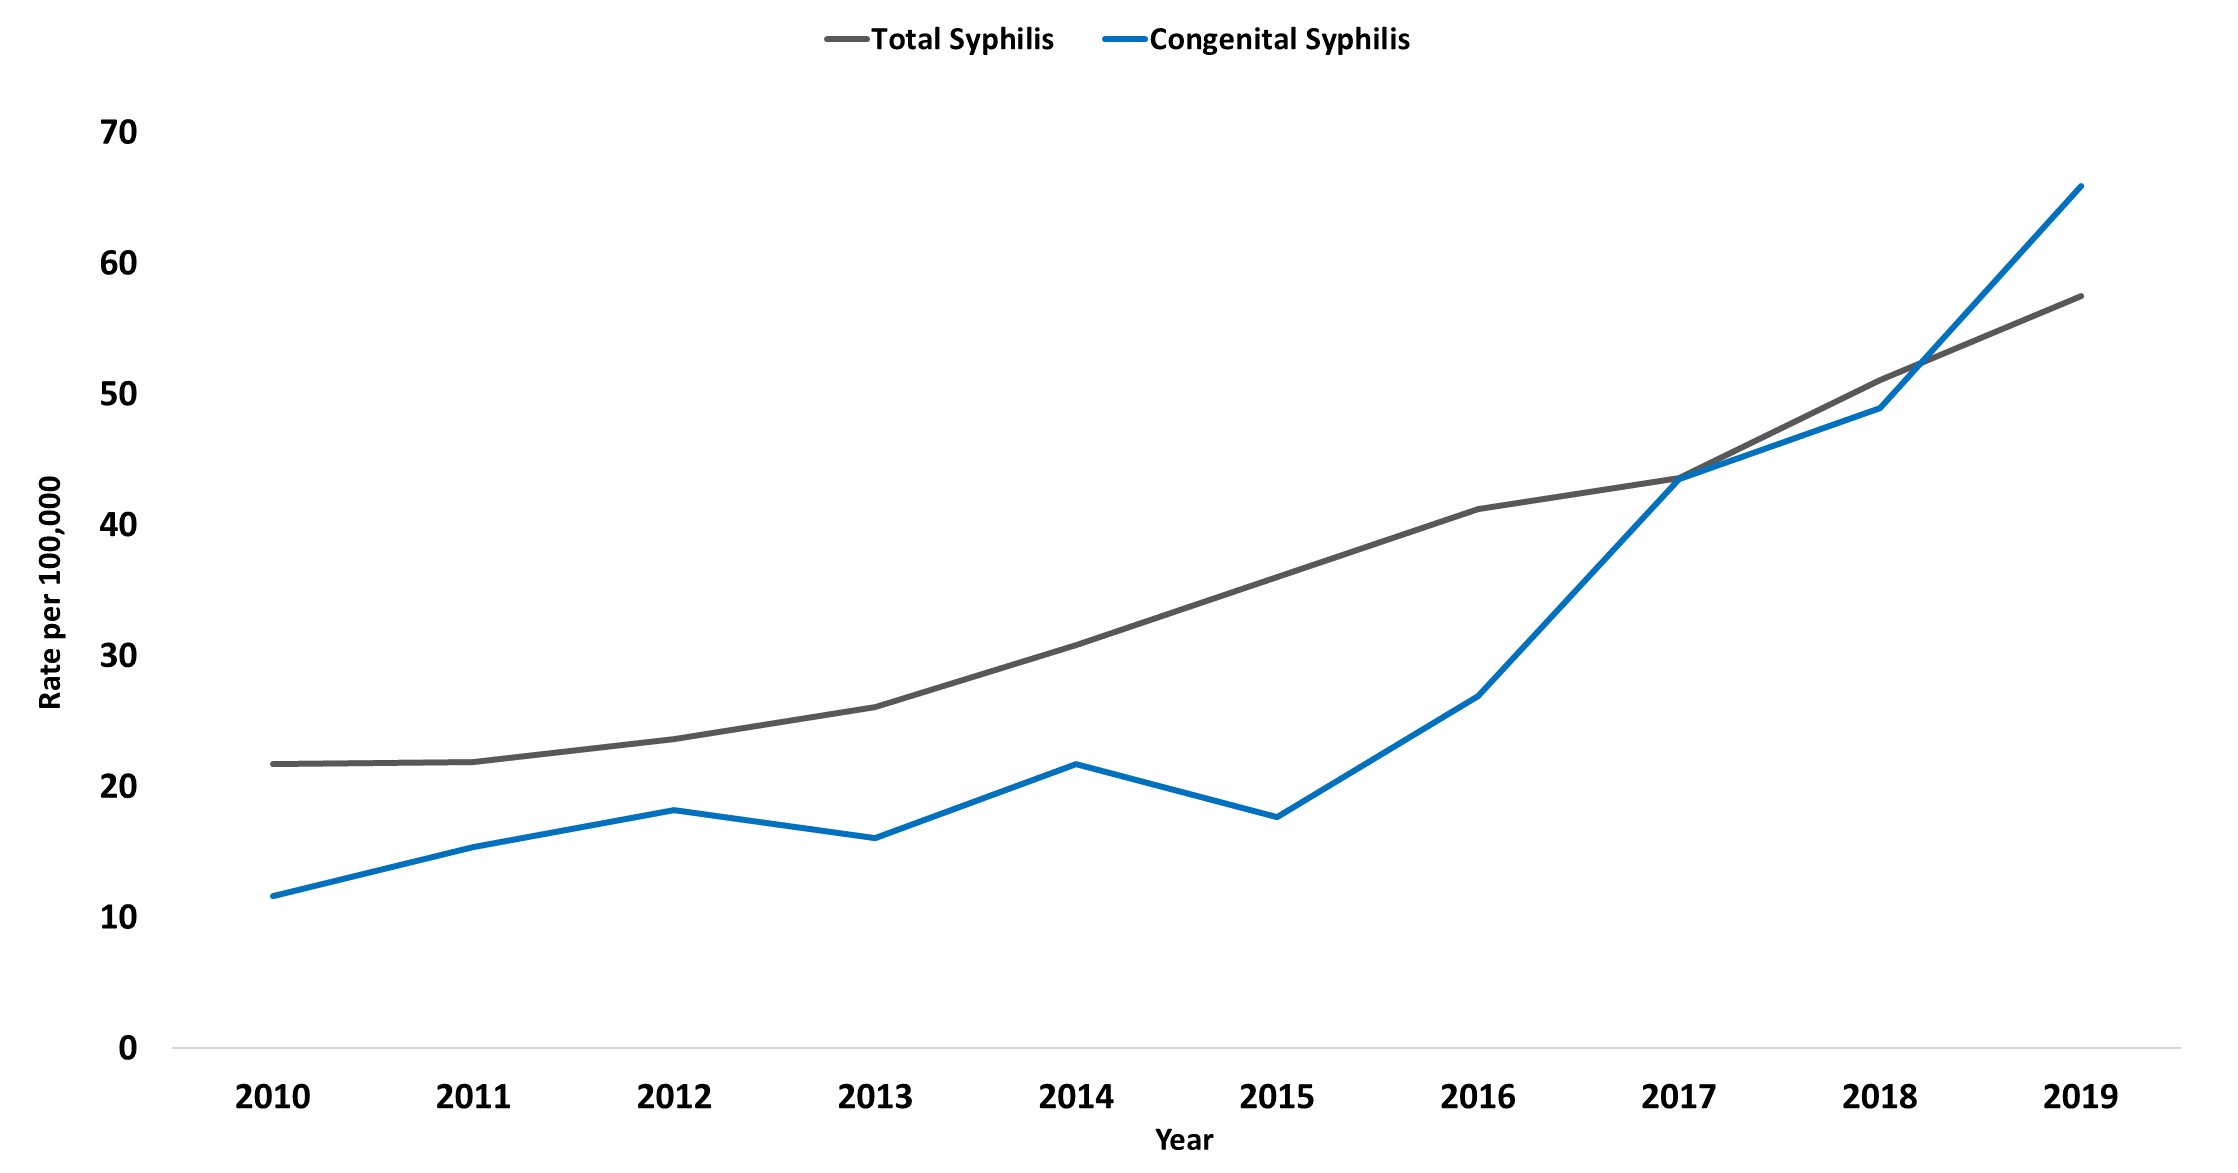
In Florida, 35 congenital syphilis cases were reported in 2013 (rate 16.1 cases per 100,000 live births). This increased 317% by 2019 to 146 reported congenital syphilis cases (rate 65.9 cases per 100,000 live births).3 In 2013-2014 only 5 infant stillbirths and deaths were reported among the congenital syphilis cases, but this increased to 26 infant stillbirths and deaths in 2018-2019. In Florida, the most common missed congenital syphilis prevention opportunity in 2018-2019 was a lack of timely prenatal care and subsequent lack of timely syphilis testing (29%). The second most common reason was a negative third trimester screen and subsequent diagnosis at delivery (18%).3
All pregnant women should be tested for syphilis at their first prenatal visit, at 28-32 weeks’ gestation during the third trimester, and at delivery. Individuals should get tested regularly for syphilis if they are sexually active and are a man who has sex with men, are living with HIV or have partner(s) who have tested positive for syphilis. If an individual is pregnant and has syphilis, the infection can be transmitted to the unborn baby. Having syphilis can lead to a low birth weight baby. It can also increase the likelihood of an early delivery or stillbirth.4
Citations
1Centers for Disease Control and Prevention. National Overview - Sexually Transmitted Disease Surveillance, 2019. Atlanta, GA. Division of STD Prevention, National Center for HIV/AIDS, Viral Hepatitis, STD, and TB Prevention; 2019.
National Overview - Sexually Transmitted Disease Surveillance, 2019 (cdc.gov)
2Centers for Disease Control and Prevention. Sexually Transmitted Infections Prevalence, Incidence, and Cost Estimates in the United States. Atlanta, GA. Division of STD Prevention, National Center for HIV/AIDS, Viral Hepatitis, STD, and TB Prevention; 2021.
STI Prevalence, Incidence, and Cost Estimates (cdc.gov)
3FL HEALTH CHARTS. Syphilis. Tallahassee, FL. Florida Department of Health. Bureau of Communicable Diseases; 2021.
4Centers for Disease Control and Prevention. Sexually Transmitted Infections Prevalence, Incidence, and Cost Estimates in the United States. Atlanta, GA. Division of STD Prevention, National Center for HIV/AIDS, Viral Hepatitis, STD, and TB Prevention; 2017.
STD Facts - Syphilis (cdc.gov)
Influenza/Pneumonia
Influenza (flu) is a contagious respiratory illness caused by influenza viruses. Serious outcomes of flu infection can result in hospitalization or death. Type A and Type B influenza are the main types of influenza that routinely spread in people (human influenza viruses). It is responsible for seasonal epidemics each year. The influenza virus infects the upper respiratory tract including the nose, pharynx, and throat. It also infects the lower respiratory tract, mainly the lungs, resulting in pneumonia which is the most common complication of influenza illness.1
Pneumonia is a lung infection that prevents your lungs from getting enough oxygen into the blood, creating a strain on the heart. Generally occurring in individuals at higher risk because of underlying chronic illnesses, influenza causes three types of pneumonia: 1) primary viral pneumonia, 2) post-illness or post-influenza bacterial pneumonia, and 3) a combined concurrent viral/bacterial pneumonia. Fortunately, life-saving vaccines are available for both influenza and some bacterial causes of pneumonia.2
An average of 36,000 deaths and over 200,000 hospitalizations are associated with influenza each year in the United States. Influenza is also responsible for substantial indirect costs ($6.2 billion annually), mainly from lost productivity. Each year, among adults ages 18 to 64 years, 17 million workdays are lost to influenza-related illness.3 The combination of influenza and pneumonia was the eighth leading cause of death among all persons in the United States in 2018, accounting for 59,120 deaths.4 In 2019, there were 2,703 deaths among Floridians from influenza and pneumonia, making this Florida’s 12th leading cause of death.4
Compared to 2016, counts and rates of influenza/pneumonia deaths have decreased. Influenza and pneumonia death counts dropped from 2,807 in 2016 to 2,703 in 2019 and age-adjusted death rates have dropped from 9.6 per 100,000 to 8.4 per 100,000 in 2019.5
| Total Influenza/Pneumonia Deaths, All Ages |
|
2016
|
2019
|
| Count
|
Rate*
|
Count
|
Rate*
|
| Influenza/Pneumonia |
2,807
|
9.6
|
2,703
|
8.4
|
| *Age Adjusted Rate
|
Influenza and pneumonia are vaccine-preventable diseases. The Centers for Disease Control and Prevention (CDC) recommends getting a flu vaccine every year to reduce the risk of serious flu complications that can result in hospitalization and death. The percentage of adults ages 18 years and older who received a flu vaccine in the past years increased from 35.0% in 2016 to 36.9% in 2019.5
| Adults who received a flu shot in the past year, Overall
|
| Year |
Percent
|
| 2016
|
35.0% (33.9 - 36.0)
|
| 2019
|
36.9% (35.3 - 38.5)
|
In the United States, the CDC and the Advisory Committee on Immunization Practices (ACIP) recommend influenza vaccines for all persons older than 6 months of age. Monitoring the performance of influenza vaccines is important for understanding and improving the benefits of vaccination.6
Florida CHARTS tracks the following related metrics: 1) Deaths from influenza and pneumonia and 2) Deaths from pneumonia.
Citations
1Centers for Disease Control and Prevention. Key Facts About Influenza (Flu). Atlanta, GA: National Center for immunization and Respiratory Disease (NCIRD); 2019.
2American Lung Association. Trends in Pneumonia and Influenza Morbidity and Mortality 2015.
3Division of Population Health. Programs | Flu & Pneumonia. Atlanta, GA: National Center for Chronic Disease Prevention and Health Promotion; 2016.
4Division of Population Health. Flu & Pneumonia Evaluation Measures. Atlanta, GA: National Center for Chronic Disease Prevention and Health Promotion; 2016.
5FL HEALTH CHARTS. Leading Causes of Death – 2019. Tallahassee, FL: Florida Department of Health; 2021.
6Grohskopf LA, Olsen SJ, et al.; Advisory Committee on Immunization Practices (ACIP). Prevention and Control of Seasonal Influenza with Vaccines: Recommendations of the Advisory Committee on Immunization Practices (ACIP) — United States, 2014–15 Influenza Season. MMWR Morb Mortal Wkly Rep 2014; 63:691–97.
Suicide Prevention
Death by suicide is caused by injuring oneself with the intent to die. An attempt at suicide is when someone harms themselves with any intent to end their life, but they do not die because of their actions.1
Nationally, suicide is the 10th leading cause of death preceded by heart disease, unintentional injury, Alzheimer’s disease and Influenza & Pneumonia.2 According to the Centers for Disease Control and Prevention (CDC) estimates, in 2019, 12 million adults seriously thought about suicide, 3.5 million adults planned suicide and 1.4 million adults attempted suicide.3 Suicide affects everyone regardless of age, race, ethnicity, and gender.
In Florida, suicide is the 8th leading cause of death, claiming 3,427 lives in 2019 with a disproportionate number occurring among men. In 2019, 2,647 men died from suicide compared to 780 women.4
Compared to 2016, counts and rates of non-fatal intentional self-harm emergency department (ED) visits and hospitalizations decreased. Among those age 10 and older, ED visits dropped from 13,032 to 12,514 with rates of 64.4 and 58.8 per 100,000 respectively. Hospitalizations declined from 9,327 to 8,370 with rates of 46.1 and 39.4 per 100,000. During the same period, however, the number and rate of deaths increased from 3,121 (rate of 17.4 per 100,000) to 3,426 in 2019 (rate of 18.1 per 100,000).5
| Total Suicide Deaths, All Ages 4 |
|
2016
|
2019
|
| Count
|
Rate*
|
Count
|
Rate*
|
| Total Suicide Deaths
|
3,122
|
15.4
|
3,427
|
16.1
|
| Total Suicide Deaths, Male
|
2,345
|
23.7
|
2,647
|
25.5
|
| Total Suicide Deaths, Female
|
777
|
7.5
|
780
|
7.2
|
| *Crude rate per 100,000 population
|
| Intentional Self-Harm, Age 10 and Older5
|
|
2016
|
2016
|
| Count
|
Rate**
|
Count
|
Rate**
|
| Emergency Department Visits
|
13,032
|
64.4
|
12,514
|
58.8
|
| Hospitalizations
|
9,327
|
46.1
|
8,370
|
39.4
|
| Suicide Deaths
|
3,121
|
17.4
|
3,426
|
18.1
|
| **Crude rate per 100,000 population age 10 and older.
|
These conditions prompted Florida to focus on suicide prevention as a priority in the State Health Improvement Plan6 by taking the following actions:
- Providing training on suicide prevention and related behaviors to community and clinical service providers.
- Increasing suicide prevention efforts for high-risk populations.
- Collaborating across agencies to develop messaging and initiatives around suicide surveillance data from the Florida Violent Death Reporting System.
The State Health Improvement Plan Annual Progress Report6 provides a status of objectives that have been achieved and those in progress.
Achieved:
- By December 31, 2019, the DCF suicide prevention website will include a training tab that will list best practices, trainings, and programs.
- By December 31, 2021, the DCF suicide prevention website will include a tab on grants and projects that have been awarded and implemented in Florida.
- By July 31, 2020, revise DCF’s suicide prevention website to include an information tab on the Marjory Stoneman Douglas High School Public Safety Act and Youth Mental Health First Aid Training.
- By December 31, 2020, create an implementation plan that focuses on suicide prevention efforts with service members, veterans, and their families.
In progress:
- By December 31, 2021, DCF, along with suicide prevention partners, will increase outreach from 0 (2019) to 500,000 individuals with a serious mental illness who may be at risk by integrating information specifically for individuals with a serious mental illness into public messaging campaigns.
- By December 31, 2021, DCF and DOH will partner to convene five (5) workgroup meetings with diverse stakeholders to expand suicide prevention efforts among focus populations identified in the state suicide prevention plan.
- By December 31, 2021, increase the number of meetings held with the 2021-2023 Florida Suicide Prevention Interagency Action Committee from 7 (2019) to 10.
These activities are coordinated through the Department of Children and Families with its participating partners which include the Florida Department of Health and the Florida Behavioral Health Association. The Centers for Disease Control and Surveillance suggest some of the following strategies for suicide prevention: strengthen access to and delivery of suicide care, create protective environments, teach coping and problem-solving skills, identify and support people at risk.6
If you need help or know someone who does you can contact the National Suicide Prevention Lifeline. Text: 24/7 to a crisis counselor by texting the Crisis Text Line. Call: 1-800-273-TALK (1-800-273-8255).
Citations
1Crosby A, Ortega L, Melanson C.
Self-directed violence surveillance: Uniform definitions and recommended data elements, version 1.0 pdf icon[PDF – 1 MB]. (2011) Atlanta, GA: Centers for Disease Control and Prevention, National Center for Injury Prevention and Control.
2CDC.
Web-based Injury Statistics Query and Reporting System (WISQARS). (2020) Atlanta, GA: Centers for Disease Control and Prevention, National Center for Injury Prevention and Control.
3Substance Abuse and Mental Health Services Administration. (2020) Key substance use and mental health indicators in the United States: Results from the 2019 National Survey on Drug Use and Health (HHS Publication No. PEP20-07-01-001, NSDUH Series H-55). Rockville, MD: Center for Behavioral Health Statistics and Quality. Retrieved from:
www.samhsa.gov/data/external icon
4FLHealthCHARTS: Suicide Deaths
5FLHealthCHARTS: Suicide and Behavioral Health Profile Report
6State Health Improvement Plan Progress Report, 2019
Hepatitis A
Hepatitis A is a communicable disease of the liver that is caused by the hepatitis A virus (HAV).1 Nationally, rates of hepatitis A have declined dramatically due to the introduction of the hepatitis A vaccine in 1996. However, in the most recent years, unexpected outbreaks across the nation have increased the number of reported cases. In the United States over 37,000 cases have been reported resulting in high rates of hospitalization and more than 340 deaths.2 Nationally, the rates of hepatitis A have increased from 0.6 per 100,000 in 2016 to 4 per 100,000 in 2018.3 In 2018, the total number of cases reported in the United States was 12,474, however due to underreporting, the actual number of cases was estimated to be 24,900.4
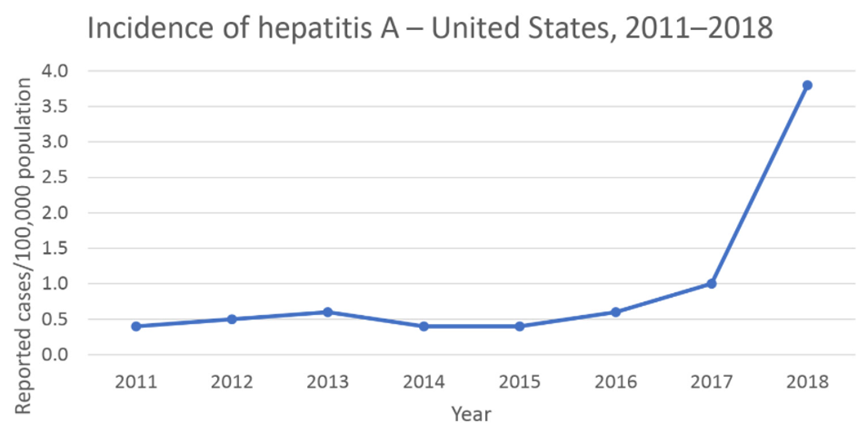
Source: CDC
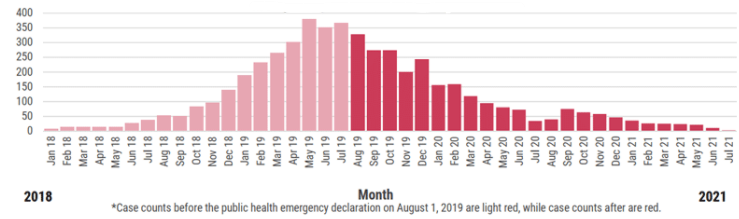
Florida has mirrored the national trend with the number of reported hepatitis A cases more than doubling from 2016 to 2017 and nearly doubling again in 2018 after several years of relative stability. Most of Florida’s cases have shared several common risk factors including injection and non-injection drug use and recently experiencing homelessness.5
In 2019, Florida had a major spike of 3,405 cases, a 500% increase compared to the 548 cases reported in 2018.5 In response to this outbreak, Florida State Surgeon General Dr. Scott Rivkees declared a Public Health Emergency to address the unexpected increase in hepatitis A cases. In 2020, the virus trended downward with only 1,002 cases reported in Florida.5 In 2021, the weekly and monthly new case totals continue to trend downward. Since January of 2021 to date, 147 cases have been reported in the state of Florida, approaching the monthly trends observed prior to the 2016-2020 outbreak.5
Source: Florida Department of Health
Citations
1Hepatitis A, Centers for Disease Control and Prevention
2Outbreaks of hepatitis A are occurring across the United States, Centers for Disease Control and Prevention
3Hepatitis A Questions and Answers for Health Professionals, Centers for Disease Control and Prevention
4Viral hepatitis surveillance—United States, 2017. Atlanta: US Department of Health and Human Services, Centers for Disease Control and Prevention; 2019.
5Hepatitis A in Florida, Florida Health
The Opioid Epidemic in Florida
Data from the Florida Department of Health’s Bureau of Vital Statistics indicates Florida’s unintentional and undetermined drug overdose deaths more than doubled from 2015 to 2019, with 2,538 deaths in 2015 and 4,294 deaths in 2019.4 The Department of Health (DOH) recently updated the Opioid Use Dashboard with 2nd quarter 2020 data for opioid-related non-fatal overdose emergency department visits and hospitalizations, as well as all drug-related non-fatal overdose emergency department visits and hospitalizations.1 DOH also released 2018 data in the Opioid Use Dashboard for Neonatal Abstinence Syndrome Birth Defect.
To assist in the opioid epidemic the Statewide Drug Policy Advisory Council 2020 Annual Report recommended some of the following action plans: Develop and implement a substance-use prevention strategy designed to reduce drug use among youth (ages 12-17). This strategy should focus on (1) the deployment of a unified antidrug messaging campaign, (2) increase/maintain substance use prevention efforts by securing/sustaining front-end prevention funding and (3) by expanding state partnerships with anti-drug coalitions, educational institutions, law enforcement, and other members of the 12 Community Sectors. Deploy an evidence-based substance use prevention program designed to reduce drug use among youth (ages 12-17). The curriculum should focus on evidence-based and/or evidence-informed prevention strategies proven to reduce substance use, while also increasing youth resiliency, coping strategies, positive mental health and responsible decision-making.1
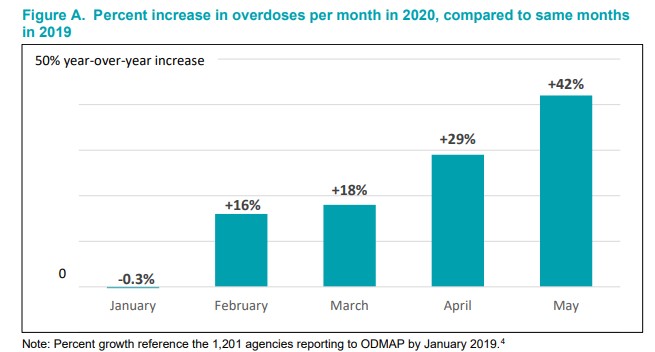
Florida and the entire nation face ongoing drug-related threats like the opioid epidemic while dealing with the new challenge of COVID-19 infections. Initial data are indicating that our communities are experiencing an increase in drug abuse during this time of COVID-19. Data from the Overdose Detection Mapping Application Program (ODMAP) indicated that nationally, compared to last year, drug overdoses increased 18% in March 2020, 29% in April 2020 and 42% in May 2020.3
The Drugs Identified in Deceased Persons by Florida Medical Examiners 2019 Annual Report indicated that there were 6,128 opioid-related deaths reported (which averages more than 16 deaths per day).5 This is 552 more than the previous year, which represents slightly under a 10 percent increase.1
There is no evidence indicating that access to naloxone encourages or increases the use of heroin or other opioids. Rather, studies suggest that increasing health awareness through naloxone training and distribution actually reduces the use of opioids.2 DCF’s Overdose Prevention Coordinator and Harm Reduction Coordinator is available to help with training and technical assistance to organizations interested in establishing targeted naloxone distribution programs.1 County health departments and federally qualified health centers can also help distribute naloxone kits to targeted at-risk populations. These entities can use EMSTARS to identify opioid overdose hotspots and develop outreach and distribution strategies to saturate at-risk individuals in those communities with naloxone.1
Citations
1 Statewide Drug Policy Advisory Council 2020 Annual Report
2 Seal, K. H., Thawley, R., Gee, L., Bamberger, J., Kral, A. H., Ciccarone, D., Downing, M., & Edlin, B. R. (2005). Naloxone Distribution and Cardiopulmonary Resuscitation Training for injection Drug Users to Prevent Heroin Overdose Death: A Pilot Intervention Study. Journal of Urban Health, 82(2), 303-311; Maxwell, S., Bigg, D., Stanczykiewicz, K., & Carlberg-Racich, S. (2006). Prescribing Naloxone to Actively Injecting Heroin Users: A Program to Reduce Heroin Overdose Deaths. Journal of Addictive Diseases, 25(3), 89-96; Wagner, K. D., Valente, T. W., Casanova, M., Partovi, S. M., Mendenhall, B. M., Hundley, J. H., Gonzalez, M., & Unger, J. B. (2010). Evaluation of an Overdose Prevention and Response Programme for Injection Drug Users in the Skid Row Area of Los Angeles, CA. International Journal of Drug Policy, 21, 186- 193; Doe-Simkins, M., Quinn, E., Xuan, Z., Sorensen-Alawad, A., Hackman, H., Ozonoff, A., & Walley, A. (2014). Overdose Rescues by Trained and Untrained Participants and Change in Opioid Use Among Substance-Using Participants in Overdose Education and Naloxone Distribution Programs: A Retrospective Cohort Study. BMC Public Health, 14(297); Jones, J. D., Campbell, A., Metz, V. E., & Comer, S. D. (2017). No Evidence of Compensatory Drug Use Risk Behavior Among Heroin Users After Receiving Take-home Naloxone. Addictive Behaviors, 71, 104-106; Marco, C. A., Trautman, W., Cook, A., Mann, D., Rasp, J., Perkins, O., & Ballester, M. (2018). Naloxone Use Among Emergency Department Patients with Opioid Overdose. Journal of Emergency Medicine, 55(1), 64-70.
3 William Wan and Heather Long (2020, July 1). Cries for help: Drug overdoses are soaring during the coronavirus pandemic. The Washington Post.
4 CHARTS Opioid Use Dashboard
5 Drugs Identified in Deceased Persons by Florida Medical Examiners 2019 Annual Report
Alzheimer’s Disease and Related Dementias (May 2021)
Alzheimer’s disease slowly destroys memory and thinking skills and, eventually, the ability to carry out the simplest tasks. It is the most common cause of dementia among the senior population. African Americans are twice as likely to suffer from this disease, and Hispanics are one and a half times as likely as older whites to have Alzheimer’s and other dementias. Prevalence is higher among women compared to men; two-thirds of Americans with Alzheimer’s disease are women.
Dementia is one of the major causes of disability and dependency among older people worldwide. Dementia has a physical, psychological, social and economic impact not only on the people with dementia, but also on their careers, families and society at large. (WHO). There is no known cure; however, innovative research may provide hope for effective and novel treatment for this incapacitating disease.
Nearly 6 million people in the United States have Alzheimer’s disease. This number will continue to increase as the population ages. Healthy People 2030 focuses on improving the care and quality of life for people with Alzheimer’s and other forms of dementia. (U.S Department of Health and Human Services) In 2019, Alzheimer’s disease was the 6th leading cause of death statewide. An estimated 556,997 Floridians ages 65 years and older had probable Alzheimer’s. About 8.8% of Floridians ages 65 years and older reported having a cognitive disability; moreover, 28.9% of this age-group lived alone (2015-19 US Census).
National death rates for Alzheimer’s disease are increasing, unlike heart disease and cancer death rates that are on the decline. Dementia, including Alzheimer’s disease, has been shown to be under-reported in death certificates and therefore the proportion of older people who die from this disease may be considerably higher. Many people living with Alzheimer’s disease are cared for at home by family members. Nationally, in 2021, the cost of caring for those with Alzheimer’s disease and other dementias is estimated at a staggering $355 billion. This cost is projected to increase to more than $1.1 trillion in 2050 (Alzheimer’s Association).
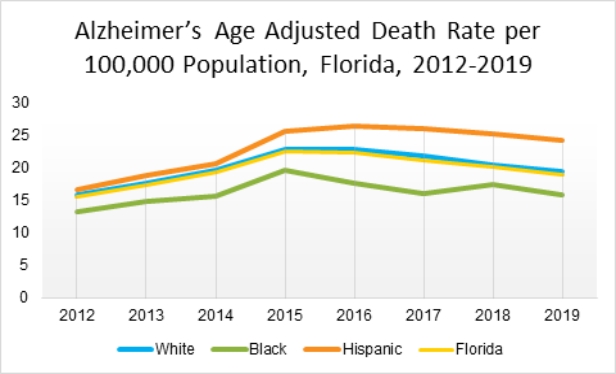
Black and Hispanic Americans are disproportionately affected by Alzheimer’s and other dementias. In 2019, the age-adjusted death rate (AADR) for Alzheimer’s disease in Florida was 18.8 per 100,000. Hispanics had the highest AADR (24.1 per 100,000), whereas Blacks had the lowest AADR (15.8 per 1000,000).
These conditions prompted Florida to focus on Alzheimer’s disease and other dementias as a priority in the State Health Improvement Plan. The Florida Department of Health and participating partners are working to support the specific needs of this vulnerable population by taking the following actions:
- Identifying a statewide system of resources and support to formalize the Alzheimer’s disease and related dementias (ADRD) network.
- Strengthening the capacity of care organizations to assess, diagnose and treat individuals with ADRD and expand support for their caregivers.
- Protecting individuals with ADRD from further vulnerability.
For additional data about Florida’s older population, see FLHealthlCHARTS.com’s Aging In Florida Profile and the Florida Department of Elder Affairs’ Demographic Profiles and Statistics.
Citations
1 Rajan KB, Weuve J, Barnes LL, McAninch EA, Wilson RS, Evans DA. Population estimate of people with clinical AD and mild cognitive impairment in the United States (2020-2060). Alzheimers Dement 2021;17. In press.
2 Rajan KB, Weuve J, Barnes LL, Wilson RS, Evans DA. Prevalence and incidence of clinically diagnosed Alzheimer's disease dementia from 1994 to 2012 in a population study. Alzheimers Dement 2019;15(1):1-7.
3 Healthy People 2030 Dementias
4 Centers for Disease Control and Prevention: Alzheimer Disease Fast Stats
5 2021 Alzheimer’s Disease Facts and Figures Special Report Race, Ethnicity and Alzheimer’s in America
Behavioral Health
Behavioral health is vital to a person’s well-being, personal relationships, and living a full and productive life.
According to the National Institute of Mental Health, research shows that mental illnesses are common in the United States, affecting tens of millions of people each year. Estimates suggest that only half of people with mental illnesses receive treatment.
Perceptions about Mental Health Surveys show that students’ and adults’ self-perceptions about mental health have declined.
Behavioral health disorders Hospitalizations for mental disorders have steadily increased over the past two decades.
Suicide Suicide rates continue to increase and are highest among White males.
Prevention Integrating behavioral health objectives within Florida’s State Health Improvement Plan acknowledges an interdisciplinary approach to prevention.
Healthy Weight, Nutrition & Physical Activity
The key to achieving and maintaining a healthy weight is about a leading a lifestyle that includes healthy eating, regular physical activity, and balancing the number of calories you consume with the number of calories your body uses. A healthy weight can also be affected by access to nutritious food. Low income and minority communities often lack food retail environments that offer affordable and healthy foods. When people do not have adequate access to healthy foods, they may settle for foods that are high in calories or have very low nutritional content.
Promoting healthy weight includes both weight loss or gain, depending on one’s current health and weight status. For those who are overweight, even a modest weight loss can have a positive impact on health. Being at a healthy weight is related to a lower risk for several serious health conditions including heart disease, diabetes, stroke and certain cancers. Healthy weight can also impact energy levels, sleep habits, self-esteem, psychological health and health care costs.
For these reasons, Florida’s State Health Improvement Plan addresses healthy weight, nutrition and physical activity as a priority. Florida is working toward improving not only the food environment and nutrition habits, but opportunities for physical activity across the lifespan.
Healthy Weight
Did you know that in 2019, only 32.8% of adults in Florida were at a healthy weight? Over time, the proportion of Florida’s population who are at a healthy weight has decreased, while obesity and overweight have increased. This condition persists across races, ethnicities, ages and genders. Obesity and being overweight disproportionally impact both Black and Hispanic populations and are also serious concerns among youths. Consider these facts:
- The percent of adults at a healthy weight was 35.6% in 2007 but declined to 32.8% by 2019 (2019: White = 34.2%, Black = 28.5%, Hispanic = 29.9%)
- The percent of overweight or obese adults was 62.1% in 2007 but rose to 64.6% by 2019 (2019: White = 63.2%, Black = 70.1%, Hispanic = 67.2%)
- The percent of middle and high school students who were overweight or obese was 26.7% in 2010 but rose to 30.4% by 2020 (2020: White = 26.7%, Black = 36.1%, Hispanic = 32.2%).
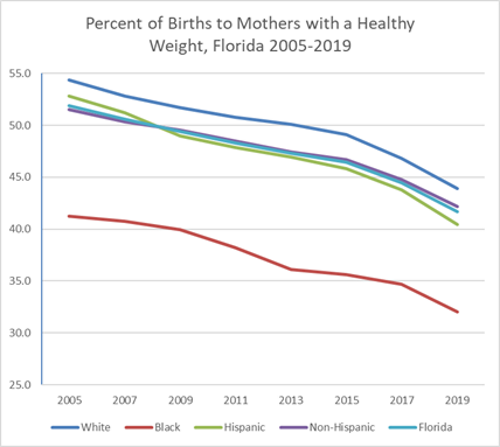
The most significant decline in healthy weight is apparent among women giving birth. Looking at pre-pregnancy weight and height on birth records shows fewer mothers are at a healthy weight as measured by BMI (body mass index).
- The percent of births to mothers who had a healthy weight at the time pregnancy occurred was 50.6% in 2007 but declined to 41.7% by 2019 (2019: White = 43.9%, Black = 32.0%, Hispanic = 40.4%).
- The percent of births to mothers who were obese at the time pregnancy occurred increased from 20.0% in 2007 to 27.1% in 2019 (2019: White = 24.8%, Black = 37.4%, Hispanic = 25.7%).
Nutrition
Food insecurity refers to a lack of available financial resources for food at the household level. For children under 18 years old, food insecurity means they do not have consistent access to enough food for an active, healthy life. Fortunately, this situation appears to be improving.
- Florida’s statewide food insecurity rate declined from 16.2% of the population in 2014 to 13.0% of the population in 2018.
- Florida’s child food insecurity rate decreased from 24.9% of children in 2014 to 19.4% of children in 2018.
Physical Activity
Physical activity levels show a declining trend with more adults reporting sedentary behavior and fewer youth reporting physical activity.
- The percent of adults who were sedentary was 25.4% in 2007 and rose to 26.5% by 2019 (2019: White = 24.1%, Black = 28.9%, Hispanic = 31.5%)
- The percent of middle and high school students who were physically active for at least 60 minutes on all 7 of the past 7 days was 23.5% in 2013 and declined to 19.5% in 2020. (2020: White = 24.6%, Black=15.2%, Hispanic = 16.2%)
The Healthy Weight Profile presents key measures of weight, activity and eating habits among adults. It also includes measures about the built environment and surroundings like parks that provide the setting for physical activity. data are available by county and for Florida. For each measure in the report, trends, quartile maps and data tables are available by clicking the links.
Learn More
Florida
National
Health Equity
Health equity means attaining the highest level of health for all people. Florida’s State Health Assessment identified health equity, including behavioral health and other key social and economic factors that influence opportunities for good health, as key contributors to health outcomes. As a result, the Florida State Health Improvement Plan addresses health equity as a priority.
Some factors that influence health equity are economic stability, education access and quality, health care access and quality, neighborhood and built environment, and social and community context. One way to quantify equity issues is by comparing rates among one population to rates in another. If all things were equal, rates in different populations would not be drastically different from each other.
The Health Equity Profile report presents key measures of health equity by county and for Florida. The report explores dimensions like distribution of opportunity, community determinants, the physical and economic environments, health services and outcomes among the Black, Hispanic and White populations. It can be used to assess areas of greatest and least disparity in Florida’s counties and statewide by using a statistic called a rate ratio.
A rate ratio is calculated by dividing one population’s rate by a reference population’s rate for the same indicator. For example, if the Black population’s rate is 10 and the White population’s rate is 5, the rate ratio is 2:1 (spoken as “2 to 1”). The Black rate is twice the White rate (calculation: 10/5=2). The graph below, provides examples of some Florida health-related statistics where the Black rate is 1.5 or more times the White rate. For example, the Black rate of children less than 18 years old below poverty level is 1.9 times the White rate.
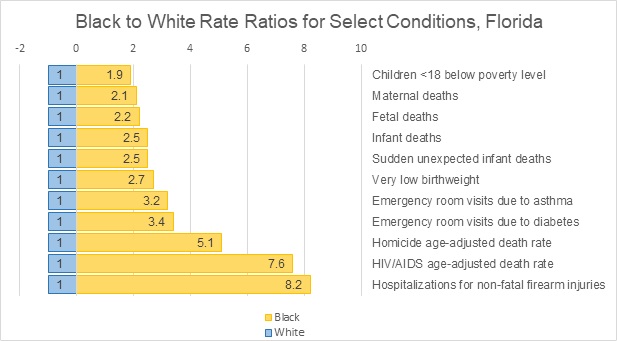
Data Sources: 1 American Communities Survey, 2015-2019, 2 Florida Vital Statistics, 2019 3 Florida Agency for Health Care Administration, 2019
Resources
State:
National:
Leading Causes of Death
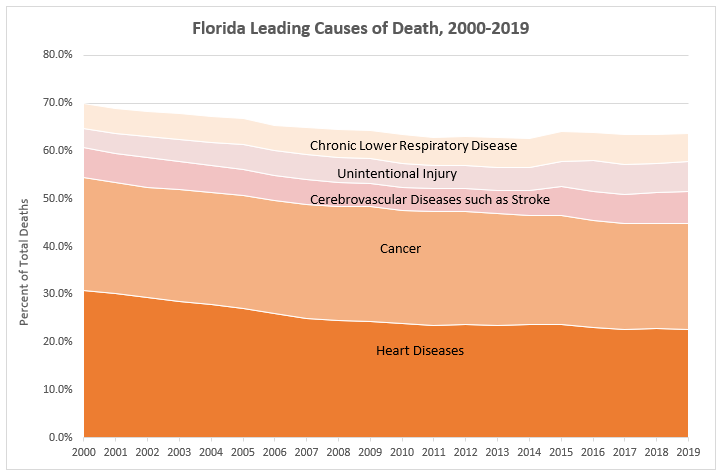
Florida’s top five leading causes of death – heart disease, cancer, cerebrovascular diseases such as stroke, unintentional injury and chronic lower respiratory disease (CLRD) – are generally attributed to over 60% of all resident deaths each year. In 2019, they accounted for 63.6% of the 206,975 deaths.
20-year high or low by cause of death. The chance of the 2019 AADR being a 20-year high or low is 1 out of 20 or 5%; so there is a 95% chance that factors other than random variation influenced these AADRs. Age-adjusted rates for three of the five leading causes of death – heart disease, cancer and CLRD – were at their lowest in 2019 when compared to their rates from 2000-2019. None of the five leading causes were at their highest age-adjusted death rates in 2019.
Percentage change over time. In 2019, among these five leading causes, unintentional injury had the greatest percentage increase (+46.8%) in age-adjusted death (AADR) rate compared to 20 years ago. Conversely, the greatest percentage decreases in the past 20 years occurred in heart disease and cancer age-adjusted death rates, Florida’s primary and secondary leading causes of death (-39.2% and -24.0% respectively). The table below shows the proportion of Florida deaths attributed to each of the top five leading causes of death since 2000.
Learn more about leading causes of death by exploring FLHealthCHARTS’ Leading Cause of Death profile report.
Cancer
Since 2014, cancer has been the second leading cause of death in Florida, after heart disease. Recent data shows that in 2019, 45,562 Floridians died from cancer. Each year, over 110,000 new cases are diagnosed and reported to the state cancer registry, the Florida Cancer Data System.
Although cancer is the second leading cause of death, there are many kinds of cancers that contribute to this statistic. The greatest number of deaths are caused by these types of cancer, in descending order: lung cancer, colorectal cancer, pancreatic cancer, cancer of the female breast and prostate cancer.
The age-adjusted cancer death rate decreased from 154.3 per 100,000 population in 2014 to 142.8 in 2019; however, cancer incidence (new cases) did not. The age-adjusted cancer incidence rate in 2014 of 426.0 per 100,000 population increased to 440.9 by 2017 (latest data available).
Preventive health care services, such as screenings, can detect cancer before symptoms start; treatment is most beneficial when cancers are detected early. The most effective cancer screenings which have led to reduced deaths include screenings for breast, cervical, lung and colorectal cancers. Screening for skin cancer, specifically melanoma of the skin, and prostate cancer has contributed to the reduced morbidity and mortality due to cancer in Florida as well.
Did you know that men have higher cancer incidence and death rates from cancer compared to women? Black females have a lower cancer incidence than White females, but there is no significant difference in their death rates. Historically, Black men have had both a higher incidence and death rate due to cancer than White men. In recent years, the gap has decreased.
| 2017 Age-Adjusted Cancer Rates |
| Incidence1 |
Deaths2 |
| Male: 473.1 |
Male: 178.1 |
| Female: 417.9 |
Female. 126.7 |
| Black females: 364.3 |
Black females: 130.2 |
| White females: 418.3 |
White females: 126.9 |
| Black males: 432.2 |
Black males: 190.2 |
| White males: 465.7 |
White males: 177.9 |
| Rates are age-adjusted per 100,000 population. |
The State Health Improvement Plan aims to reduce cancer incidence and increase cancer survival. FLHealthCHARTS.gov offers additional information through its cancer incidence and death indicators as well as the death query system. To learn more about cancer control efforts in Florida, please visit this page: http://www.floridahealth.gov/diseases-and-conditions/cancer/cancer-control-florida.html
References
Injury, Safety and Violence
Unintentional injuries are the fourth leading cause of death in Florida overall after heart disease, cancer and stroke. Unintentional injuries include other events such as falls, drowning, and car crashes. Intentional injuries include events such as homicide or suicide. Overall, suicides are the eighth leading cause of death, while homicides are the fifteenth leading cause of death in Florida.
Unintentional injuries such as falls and motor vehicle crashes, and intentional injuries such as intimate partner violence are a major cause of death for people ages 1 to 44; however, most injuries are predictable and preventable. In 2019, unintentional injuries were the fourth leading cause of death overall after heart disease, cancer and stroke, accounting for 13,213 deaths while suicides were the eighth leading cause with 3,427 deaths. Including all injury deaths, both unintentional and intentional, over 18,100 Floridians lost their lives. Moreover, injury caused 144,050 hospitalizations and 1,891,631 emergency department visits.
For this reason, Florida’s State Health Improvement Plan is working to prevent and reduce unintentional and intentional injuries and deaths in Florida. Specific strategies include:
- promoting evidence-based falls prevention programs serving elders,
- preventing child drowning,
- addressing violence through partnerships that focus on common risk and protective factors,
- improving the transportation network to reduce motor vehicle fatalities and injuries on our streets and highways, and
- decreasing morbidity and mortality from injury through effective support and monitoring of Emergency Medical Services (EMS) and Trauma Systems of Care.
Recently the Injury, Safety and Violence priority area workgroup invited the Behavioral Health workgroup to begin a discussion on overlapping goals, including suicide prevention, drug use, and Adverse Childhood Experiences (ACEs).
FLHealthCHARTS.gov offers additional information through its Fatal Injury, Non-Fatal Injury Dashboard, Non-Fatal Injury Hospitalization, and Non-Fatal Injury Emergency Department Visit Reports. To learn more about the Florida Department of Health’s Violence and Injury Prevention Section and its priorities, please visit this page: http://www.floridahealth.gov/programs-and-services/prevention/injury-prevention/index.html.
Sexually Transmitted Disease (STD)
Syphilis is a sexually transmitted disease caused by the bacterium treponema pallidum. It has often been called "the great imitator" because so many signs and symptoms are indistinguishable from those of other diseases. When not adequately treated, syphilis can lead to visual impairment, hearing loss, stroke, and other neurological problems. Congenital syphilis is a severe, disabling, and often life-threatening infection seen in infants. A pregnant mother who has syphilis can transmit the disease through the placenta to the unborn infant. Congenital syphilis can cause miscarriage, stillbirth, or early infant death, and infected infants can experience lifelong physical and neurologic problems. Florida reports cases of congenital syphilis based on a standardized surveillance case definition developed by the Council of State and Territorial Epidemiologists.
The Centers for Disease Control (CDC) and Prevention reported increases in syphilis nearly every year since 2001. In 2018, Florida’s primary and secondary syphilis (syphilis that is infectious) rate was 13.7 per 100,000 population, surpassed only by six other states: Louisiana (14.3), New Mexico (14.9), Georgia (15.4), Alabama (15.5), California (19.2) and Nevada (22.7). 1
Florida’s syphilis rates are increasing. Early syphilis (syphilis acquired within a year) rates increased, from 8.3 per 100,000 population in 2006 to 34.8 in 2019 (Figure 1). Among males ages 15–44, rates of total syphilis increased from 42.4 per 100,000 population in 2006 to 176.0 in 2019; among females, rates increased from 19.1 per 100,000 population to 46.3 in 2019 (Figure 2). Florida’s congenital syphilis rates have increased from 8.8 per 100,000 live births and fetal deaths in 2006 to 65.9 in 2019 (Figure 3).
The Florida Department of Health, in partnership with the CDC; Healthy Start Coalitions of Miami-Dade, Broward, Orange and Duval Counties; The Gay, Lesbian, Bisexual, Transgender, Queer Center of Central Florida; BLISS Healthcare Services and Florida Department of Education, are working to reduce syphilis rates. Florida’s State Health Improvement Plan includes objectives for reducing rates of early syphilis, syphilis cases among women of reproductive age (15–44), and congenital syphilis cases.
Figure 1. Early Syphilis
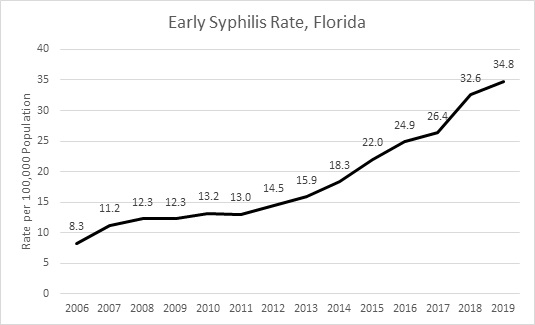
Source: FLHealthCHARTS.gov
Figure 2. Total Syphilis
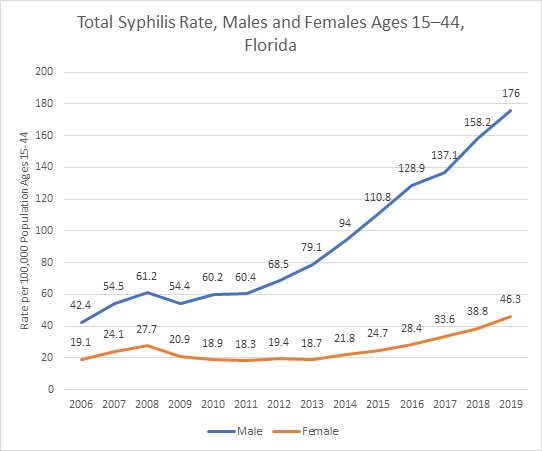
Source: FLHealthCHARTS.gov
Figure 3. Congenital Syphilis
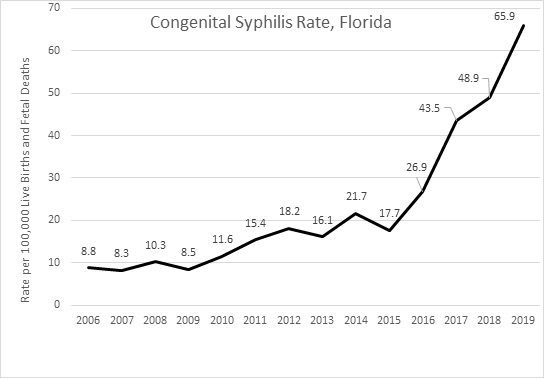
Source: FLHealthCHARTS.gov
Learn More
Florida
National
References
Immunizations & Influenza
Vaccination protects adults and children from serious disease. Being immunized also reduces the risk of complications from certain diseases, especially among those with compromised immune systems, by reducing the chance of passing on serious diseases to others. The World Health Organization (WHO) cites multiple benefits of vaccination including elimination of diseases, reduction of morbidity and complications, protection of the unvaccinated population, and prevention of related diseases and certain cancers. As the 2020 flu season approaches, the Centers for Disease Control and Prevention is recommending early flu vaccine for children 6 months through 8 years of age who need 2 doses and later vaccinations (starting September) for older adults.
Florida’s State Health Improvement Plan addresses vaccination and influenza as a priority, and we are working toward improving access to vaccines across the lifespan. Specific objectives focus on improving access to vaccines for pregnant women, infants, children and teens. Approximately 83.5% of 2-year olds received the basic vaccine series, and 93.5% and 96.1% of kindergarten and 7th grade students, respectively, were up to date with recommended vaccines during school year 2019-20.
Learn More
Florida
National & International
Suicide Prevention
Suicide is among the top 10 leading causes of death in the United States (CDC). In Florida, suicide is the 8th leading cause of death, claiming over 3,427 lives in 2019. Additionally, suicide attempts result in an even larger number of non-fatal, intentional self-harm injuries. In 2018, the latest data currently available, over 20,000 non-fatal intentional self-harm hospitalizations and emergency department visits occurred. These conditions prompted Florida to focus on suicide prevention as a priority in the State Health Improvement Plan by taking the following actions:
- Providing training on suicide prevention and related behaviors to community and clinical service providers.
- Increasing suicide prevention efforts for high-risk populations.
- Collaborating across agencies to develop messaging and initiatives around suicide surveillance data from the Florida Violent Death Reporting System.
The Department of Children and Families coordinates these activities with its participating partners, the Florida Department of Health and the Florida Behavioral Health Association.
Get Data:
Learn More:
Hepatitis A
Hepatitis A is a vaccine-preventable, communicable disease of the liver caused by the hepatitis A virus. Nationally, hepatitis A infection rates have increased since 2016, when reported cases went from 0.6 per 100,000 population to nearly 4.0 per 100,000 population in 2018.
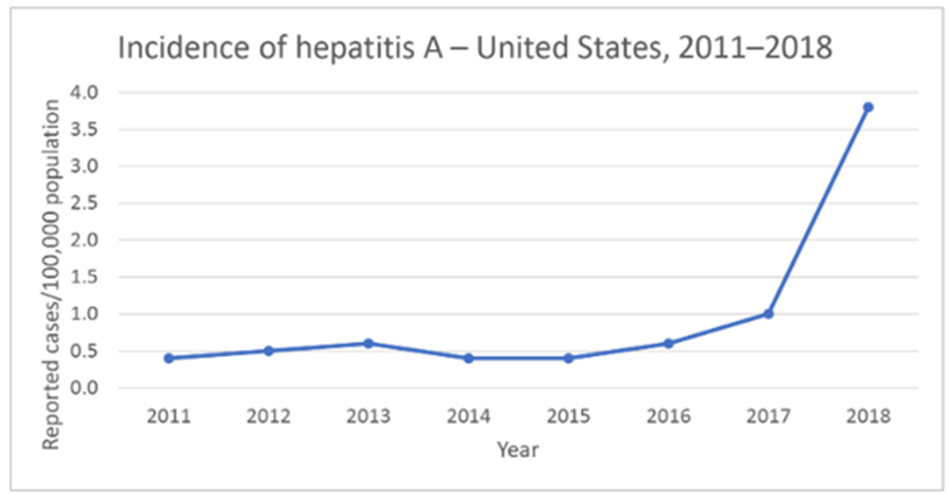
Source: CDC, https://www.cdc.gov/hepatitis/hav/havfaq.htm#general
Florida also saw an increase in hepatitis A infections in recent years. After several years of relative stability, the number of reported hepatitis A cases more than doubled from 2016 to 2017 and dramatically increased in 2019. Since February 2020, the number of cases reported each month decreased but still remain above expected levels. Since January 2018, 98% of Florida’s cases were likely acquired in Florida and share several common risk factors including both injection and non-injection drug use and recently experiencing homelessness. The best way to prevent hepatitis A infection is through vaccination.
Hepatitis A Cases, Florida
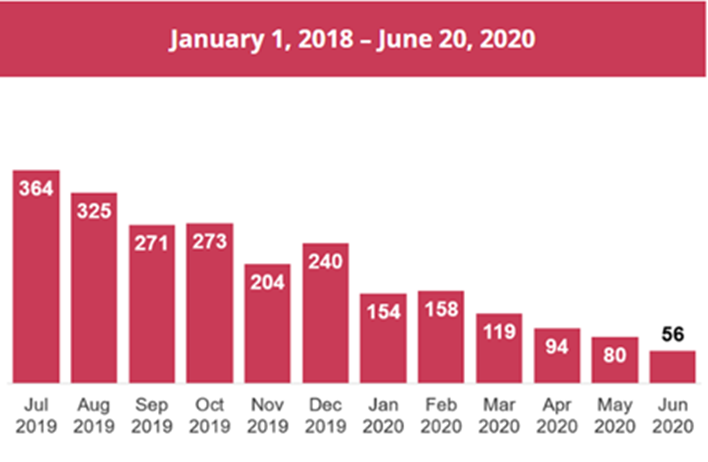
Source: Florida Department of Health, as of 6/20/20 www.flhealth.gov/hepadata
Learn More: www.flhealth.gov/hepadata
Get Data: Hepatitis A
Alzheimer’s Disease and Related Dementias
Alzheimer’s disease slowly destroys memory and thinking skills and, eventually, the ability to carry out the simplest tasks. It is the most common cause of dementia among the senior population. African Americans are twice as likely, and Hispanics are one and a half times as likely as older whites to have Alzheimer’s disease and other dementias. Prevalence is higher among women compared to men; two-thirds of Americans with Alzheimer’s disease are women.
Dementia is one of the major causes of disability and dependency among older people worldwide. Dementia has a physical, psychological, social, and economic impact, not only on people with dementia, but also on their careers, families and society at large. (WHO). There is no known cure, however, innovative research may provide hope for effective and novel treatment for this incapacitating disease.
In Florida, in 2018, Alzheimer’s’ disease was the 6th leading cause of death statewide, and an estimated 553,734 Floridians 65 years and older had probable Alzheimer’s. About 8.5% of Floridians over 65 years and older reported having a cognitive disability; moreover, 24.4% of this age-group lived alone (2014-18 US Census). These conditions prompted Florida to focus on Alzheimer’s disease and other dementias as a priority in the State Health Improvement Plan. The Florida Department of Health and participating partners are working to support the specific needs of this vulnerable population by taking the following actions:
- Identifying a statewide system of resources and support to formalize the Alzheimer’s disease and related dementias (ADRD) network.
- Strengthening the capacity of care organizations to assess, diagnose and treat individuals with ADRD and expand support for their caregivers.
- Protecting individuals with ADRD from further vulnerability.
Participating partners include the University of South Florida Morsani College of Medicine, Alzheimer’s Association, Mayo Clinic, University of South Florida Byrd Alzheimer’s Center and Research Institute, Florida Association of Community Health Centers, Florida Atlantic University, Florida A&M University, Alzheimer’s advocate and University of South Florida College of Public Health.
For additional data about Florida’s older population, see FLHealthlCHARTS.com’s Aging In Florida Profile and the Florida Department of Elder Affairs’ Demographic Profiles and Statistics.
Behavioral Health
Behavioral health disorders, including mental illness and substance abuse, are often inter-connected with other general medical conditions. People who grow up in good physical health are more likely to also have good mental health. Similarly, good mental health often contributes to maintenance of good physical health. National Research Council and Institute of Medicine.
Consider the following statistics for Florida:
- 28.3% of middle and high school students reported that, within in the past year, they felt sad or hopeless for two or more weeks in a row and stopped doing usual activities (YTS, 2019).
- 12.1% of middle and high school students reported that within the past year, they did something to purposely hurt themselves without wanting to die (YTS, 2019)
- 15.6% of adults reported ever having had a depressive disorder. (BRFSS, 2018)
- 12.8% of adults reported having poor mental health on 14 or more of the past 30 days (BRFSS, 2018)
Recent research suggests that preventing mental, emotional, and behavioral disorders is inherently interdisciplinary and draws on a variety of different strategies1. For example, improving family functioning and positive parenting has positive effects on mental health and can reduce poverty-related risk. Integrating behavioral health objectives within Florida’s State Health Improvement Plan acknowledges this interdisciplinary approach. One goal is to reduce mental, emotional and behavioral health disorders in children through improved identification and treatment of behavioral health disorders in parents who come in contact with the child welfare system. Other goals include decreasing the number of newborns experiencing neonatal abstinence syndrome, reducing the number of opioid overdose deaths among individuals with opioid use disorders and reducing the number of suicides in Florida.
FLHealthCHARTS.gov Reports
National & International
1 Lando J, Marshall Williams S, Sturgis S, et al. A logic model for the integration of mental health into chronic disease prevention and health promotion. Prev Chronic Dis. 2006 April;3(2):A61.
Healthy Weight, Nutrition & Physical Activity
Healthy eating and physical activity are keys to maintaining a healthy weight. Being at a healthy weight is related to a lower risk for several serious health conditions including heart disease, diabetes, stroke, and certain cancers. Promoting healthy weight includes both weight loss or gain, depending on one’s current health and weight status. For those who are overweight, even a modest weight loss can have a positive impact on health. Healthy weight can also impact energy levels, sleep habits, self-esteem, psychological health and health care costs. For these reasons, Florida’s State Health Improvement Plan addresses healthy weight, nutrition and physical activity as a priority. Florida is working toward improving not only the food environment and nutrition habits, but opportunities for physical activity across the lifespan.
Did you know that in 2018, only 32.2% of adults in Florida were at a healthy weight? Overweight and obesity is also a serious concern among our youth and disproportionally impacts black and Hispanic youths. The Healthiest Weight Profile presents key measures of weight, activity, and eating habits among adults and also includes measures about the built environment. data are available by county and for Florida. For each measure in the report, trends, quartile maps and data tables are available by clicking the links.
Florida
National
Health Equity
Health equity means attaining the highest level of health for all people. Florida’s State Health Assessment identified health equity, including social and economic factors, as key contributors to health outcomes. Consequently, Florida’s State Health Improvement Plan addresses health equity as a priority. The Health Equity Profile presents key measures of health equity by county and for Florida. The report explores dimensions like distribution of opportunity, community determinants, the physical and economic environments, health services and outcomes. Rate ratios are provided to understand health equity issues in Florida’s counties. The Community Social and Economic Factors report displays contextual factors such as poverty, employment, educational attainment, income, health insurance and more by census tract, by county and for Florida.
Click here for more data.
Florida
National